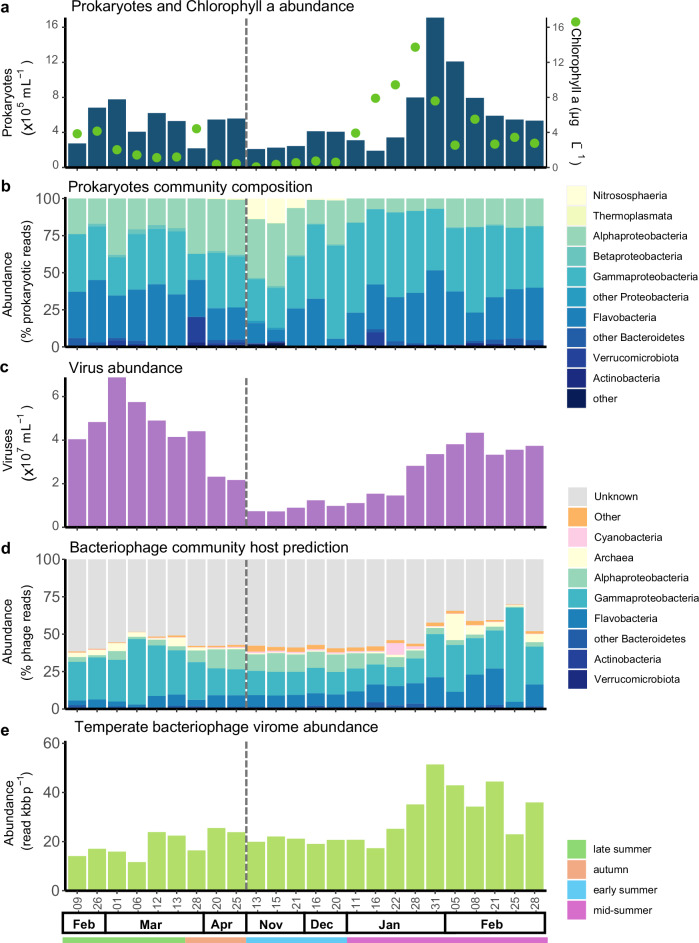
Fig. 3. Bacteriophage and prokaryotic host dynamics.
a Absolute prokaryotic abundances determined by flow cytometry, and chlorophyll a concentration. b Prokaryotic relative abundance (% of prokaryotic reads, > 0.2 µm) determined by PhyloFlash assembled 16S rRNA gene assembly at the class rank. c Absolute viral abundance determined by flow cytometry. d bacteriophage relative abundance (% of bacteriophage reads, < 0.2 µm) of mid to high-quality prokaryotic virus (longer than 10 kb or 70% complete) coloured according to the predicted host class. e abundance of viral scaffolds containing integrase expressed in vertical coverage (read bases per scaffold bases) for the viral fraction (< 0.22 µm). The grey dashed line indicates the winter sampling gap.

