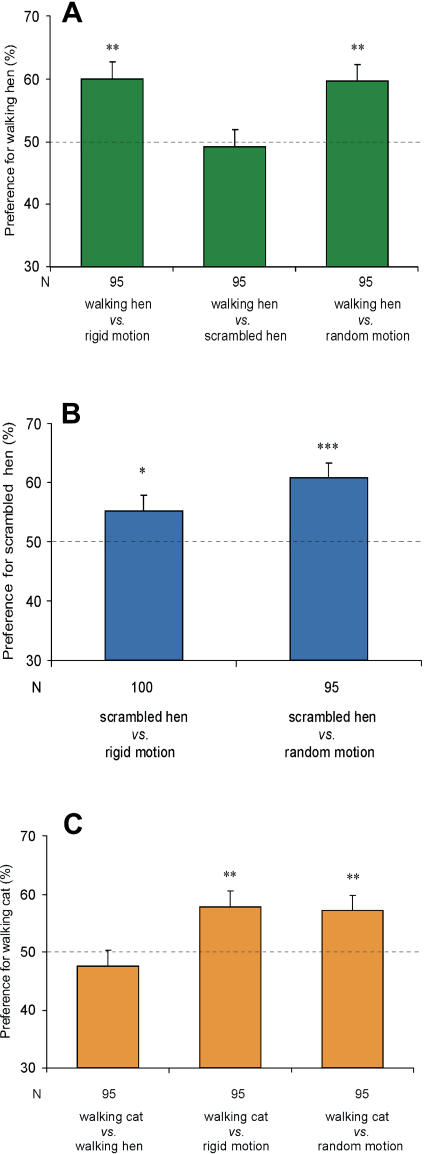
Figure 3. Point-Light Sequence Preferences.
(A) Preferences (group means and the standard error of the mean) estimated as the percentage of time spent close to the walking hen.
(B) Preferences are shown as the percentage of time spent close to the scrambled hen.
(C) Preferences are shown as the percentage of time spent close to the walking cat.
Asterisks indicate significant departures from chance level (i.e., 50%) estimated by one-sample two-tailed t tests (*p < 0.05; **p < 0.01; ***p < 0.001).

