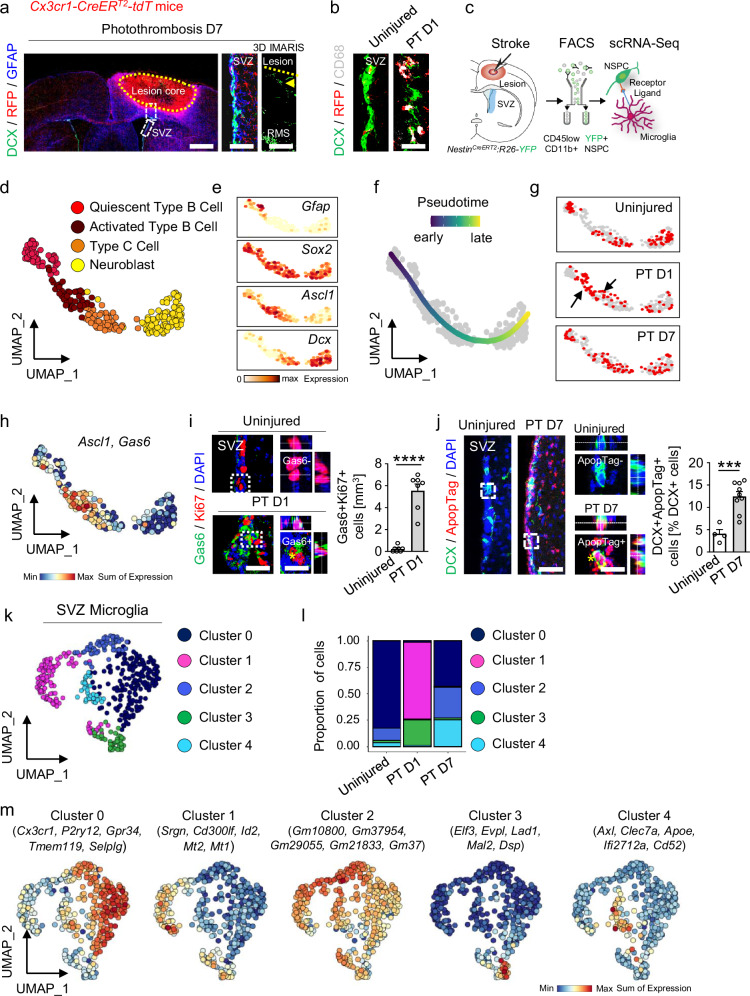
Fig. 1. SVZ neuroblast cell death and distinct SVZ microglial subclusters after cortical stroke.
a DCX immunostaining (green) in combination with RFP (red) and GFAP (blue) labeling in the SVZ and the lesion penumbra 7 days after PT. White boxes indicate enlarged areas showing the SVZ showing DCX and RFP expression, and IMARIS reconstruction of the lesion penumbra, with few DCX + migratory neuroblasts (arrowhead) (n = 1). The lesion core is indicated by a dotted line. Scales (l to r): 750, 100, 260 µm. b DCX immunostaining (green) with RFP (red) and CD68 (gray) labeling in the SVZ 1 day after PT, indicating early SVZ microglia activation after cortical stroke (n = 1). Scale, 15 µm. c scRNA-Seq and analysis of SVZ NSPCs and microglia after PT. d UMAP representation of four NSPC clusters from Supplementary Fig. 1i. e NSPC cluster-specific gene expression defining their localization along the UMAP of Supplementary Fig. 1i. f UMAP visualization of fate-mapped NSPCs captures differentiation from quiescent type B cells to neuroblasts after PT. g Pseudotime progression along the NSPC differentiation trajectory after PT. Black arrows indicate type B cell activation and differentiation at day 1 after PT. h Ascl1 + proliferative type C cells co-express Gas6 after PT. i Immunolabeling for Gas6 (green) and Ki67 (red) in the SVZ 1 day after PT. Dashed boxes indicate magnifications of Gas6 − Ki67 + (top) and Gas6 + Ki67 + cells (bottom, asterisk). Scales, 24(left), 13 µm (magnified images). Right, quantification (n = 7 mice). j Immunolabeling for DCX (green) and ApopTag (red) in the SVZ 7 days after PT. Dashed boxes indicate magnifications of ApopTag−DCX + (top) and ApopTag + DCX + cells (bottom, asterisk) of control and 7 days after PT, respectively. Scales, 50 (left), 16 µm (magnified images). Right, quantification (n = 4 mice, uninjured; n = 9 mice, PT D7). k UMAP representation of five distinct microglial clusters obtained after subcluster analysis of the identified microglial cluster in Supplementary Fig. 1i. l Quantification of microglial cluster proportions. m UMAP plots of expression of core signature genes of SVZ microglial cluster. All graphs show the mean ± SEM. ***P < 0.001, ****P < 0.0001, unpaired Student’s t tests. RMS, rostral migratory stream; SVZ, subventricular zone. Source data are provided as a Source Data file.

