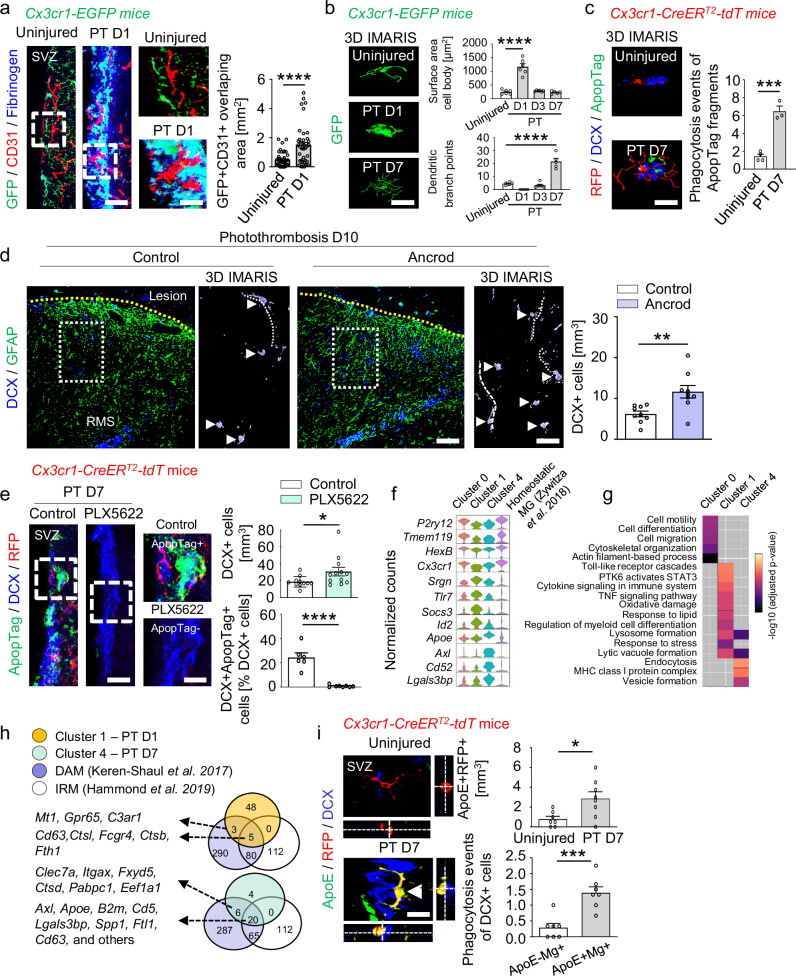
Fig. 2. Stroke-associated microglia phagocytose dying neuroblasts and reduce the SVZ neurogenic response.
a Immunolabeling for GFP (microglia, green), CD31 (blood vessels, red), and fibrinogen (blue) 1 day after PT. Scales, 18 (left), 10 µm (magnified images). Quantification of overlap between GFP + microglia and CD31 + blood vessels 1 day after PT (n = 3 mice; 46 cells, uninjured; 40 cells, PT D1). b Reconstructions of microglia (green) and IMARIS quantification of GFP + microglia 1, 3, and 7 days after PT (n = 6 mice, uninjured, PT D1, PT D3; n = 5 mice, PT D7). Scale, 7 μm. c IMARIS reconstruction of DCX + ApopTag + dying neuroblasts engulfed by RFP + microglia (red) 7 days after PT (bottom). Scale, 7 μm. Quantification of ApopTag + fragments in RFP+ microglia in the SVZ (n = 4 mice, uninjured; n = 3 mice, PT D7). d Immunolabeling for DCX (blue) and GFAP (green) in the lesion penumbra 10 days after PT. Dotted rectangles indicate magnified images. Arrowheads indicate individual DCX + cells, and dotted lines indicate DCX + processes. Scales, 130 (left), 63 µm, (magnified images). Right, quantification 10 days after PT (n = 9 mice). e Immunolabeling for ApopTag (green), DCX (blue), and RFP (red) in the SVZ 7 days after PT in PLX5622-fed mice. Dashed rectangles indicate magnified images showing ApopTag + DCX + (top) and ApopTag−DCX + cells (bottom). Scales, 38 (left), 7 μm (magnified images). Quantification of DCX + cells (top) and percentage of ApopTag + DCX + cells (bottom) 7 days after PT in PLX5622-fed mice (top: n = 11, control; n = 12, PLX5622; bottom: n = 6, control, n = 8, PLX5622). f Violin plots of markers enriched in stroke-associated microglial clusters 1 and 4, compared with cluster 0 and ref.11. g Gene ontology term enrichment analysis (adjusted p-value < 0.05) using the same clusters. Gray boxes indicate no enrichment. h Venn diagram showing the overlap between genes of neurodegenerative disease–associated microglia (purple, disease-associated microglia (DAM)26; and white, injury-responsive microglia (IRM)36) and DEGs 1 (orange) and 7 days (green) after PT. i Immunolabeling for ApoE (green), RFP (red), and DCX (blue), 7 days after PT. Arrowhead indicates ApoE + RFP + microglia phagocytosing a DCX + neuroblast. Scale, 14 μm. Quantification in uninjured mice and 7 days after PT (top) (n = 7 mice, uninjured; n = 8 mice, PT D7) and of DCX + cells engulfed by microglia (Mg, bottom) (n = 7 mice) in the SVZ 7 days after PT. All plots show mean ± SEM. *P < 0.05, **P < 0.01, ***P < 0.001, ****P < 0.0001, one-way ANOVAs with Bonferroni corrections for multiple comparisons (b) and unpaired Student’s t tests (a, c–e, i). RMS, rostral migratory stream; SVZ, subventricular zone. Source data are provided as a Source Data file.

