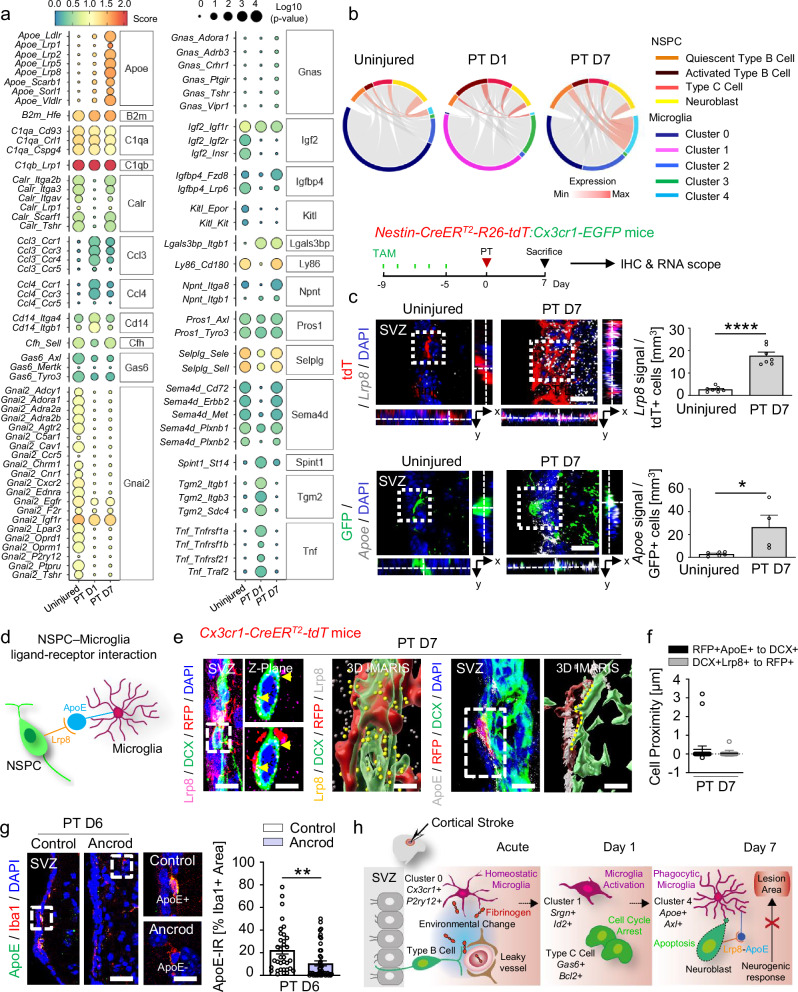
Fig. 3. Ligand-receptor pair interactions between NSPCs and microglia after cortical stroke.
a Dot plot of interaction scores for ligand-receptor pairs and operating signaling pathways 1 and 7 days after PT. b Chord plot of ApoE-Lrp8 ligand-receptor interactions across clusters and NSPC subpopulations within the consensus atlas, based on co-expression 1 and 7 days after PT. c In situ hybridization for Lrp8 (gray) with immunolabeling for RFP + NSPCs (red) in the SVZ 7 days after PT. Scale bar, 12 μm. Quantification of Lrp8 + RFP + cells 7 days after PT (n = 7 mice). In situ hybridization for Apoe (gray) with immunolabeling for GFP + microglia (green) in the SVZ 7 days after PT. Scale, 12 μm. Quantification of Apoe + GFP + cells 7 days after PT (n = 6, uninjured; n = 4, PT D7). d Schematic of the NSPC-microglia Lrp8-ApoE cross-communication. e Left images: Immunolabeling for Lrp8, DCX, and RFP in the SVZ 7 days after PT. Higher magnification of dashed square showing Z-plane with (bottom) and without (top) RFP illustrating the location of Lrp8 (arrowheads) on DCX + cells in close contact with RFP + cells. IMARIS reconstruction of Lrp8, DCX, and RFP. DCX + cell surface expression of LRP8 (yellow dots) in contact with RFP + cells. Right pair of images: Immunolabeling for ApoE, RFP, and DCX 7 days after PT. IMARIS reconstruction of the ApoE + RFP + cell in the dashed rectangle in contact with a DCX + cell. The area of contact between the RFP + and DCX + cells is indicated by the yellow dashed line. Scales, 12 µm (SVZ, Lrp8); 6 μm, magnified images; 3 μm, 3-D IMARIS; 8 μm (SVZ, ApoE); 6 μm, 3-D IMARIS. f Quantification of the smallest distance between RFP + ApoE + cells and DCX + cells and between DCX + Lrp8 + cells and RFP + cells 7 days after PT (n = 3 mice; 23 pairs of cells, RFP + ApoE + cells to DCX + cells; 18 pairs of cells, DCX + Lrp8 + to RFP + cells). g Immunolabeling for ApoE and Iba1 in fibrinogen-depleted mice 6 days after PT. Dashed boxes indicate the magnification of ApoE + Iba1 + (top, control) and ApoE−Iba1 + cells (bottom, ancrod) 6 days after PT. Scales, 28 µm, left; 10 µm, magnified images. Right, quantification of the ApoE immunoreactivity (IR) in Iba1 + cells in fibrinogen-depleted mice compared with control-treated mice 6 days after PT (n = 6 mice, control group (34 cells); n = 5 mice, ancrod group (44 cells)). Plots show mean ± SEM. *P < 0.05, **P < 0.01, ****P < 0.0001, unpaired Student’s t tests. h In the healthy brain, NSPCs of the SVZ generate mobile DCX + neuroblasts that migrate through the RMS to the olfactory bulb to become newborn neurons. Cortical injury (cortical stroke, acute) results in increased permeability of the SVZ vasculature and a drastic change in the SVZ stem cell niche environment (e.g., fibrinogen deposition). This induces increased NSPC proliferation, cell-cycle arrest of type C cells, and immediate microglial activation (cortical stroke, day 1 after PT). Microglia phagocytose apoptotic newborn neuroblasts through the predicted ligand-receptor pair ApoE–Lrp8, resulting in limited neurogenic cell replacement in the cortical lesion area (cortical stroke, day 7 after PT). SVZ, subventricular zone. Source data are provided as a Source Data file.

