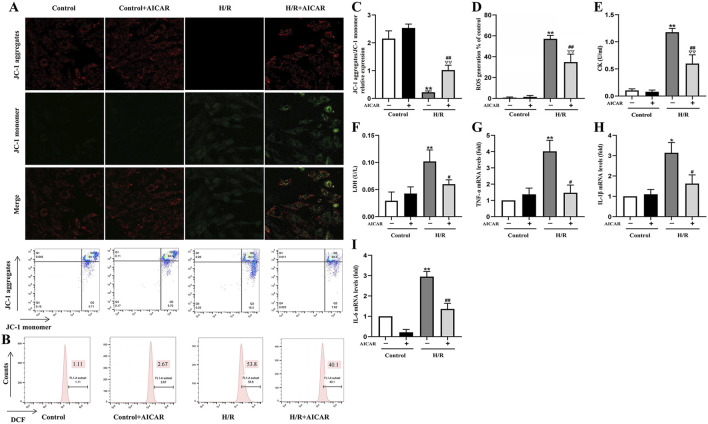
FIGURE 3.
Activation of AMPK protected H9C2 cells from H/R induced injury. (A) Representative fluorescent and flow cytometer images of JC-1 (Green fluorescence represents monomer JC-1, and red fluorescence represents aggregate JC-1). (B) Representative images of mitochondrial ROS levels by flow cytometry. (C) Quantification of the MMP by detecting the red-to-green fluorescence intensity ratio. (D) AICAR decreased the ROS generation in H9C2 cells. (E, F) AICAR decreased the levels of CK and LDH in culture supernatant of H9C2 cells. (G–I) AICAR decreased the mRNA expression of TNF-α, IL-1β, and IL-6 in H9C2 cells. The data were expressed as mean ± SEM (n = 6 per group). ** p < 0.01, * p < 0.05 vs. Control group; ▽▽ p < 0.01 vs. Control + AICAR group; ## p < 0.01, # p < 0.05 vs. I/R group.

