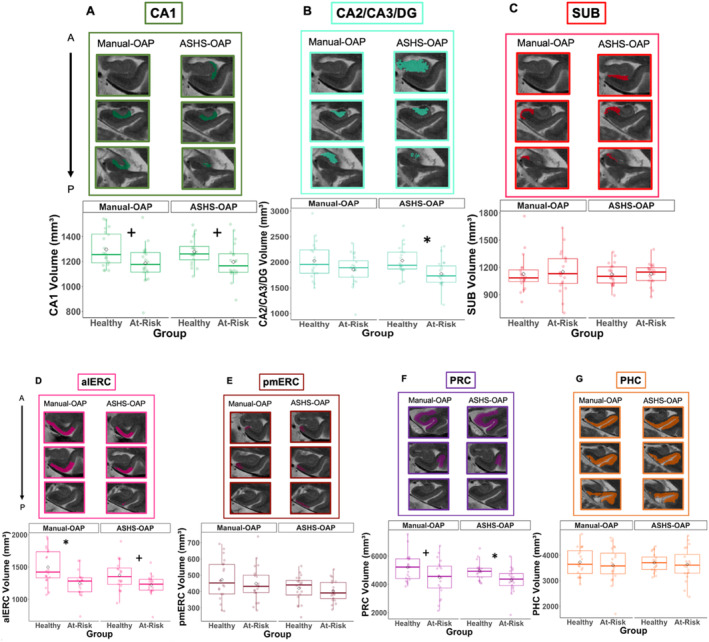
FIGURE 3.

Hippocampal subfields and MTL cortical volumes. Box plots, plotted separately for healthy and at‐risk participants and segmentation method (Manual‐OAP on the left and ASHS‐OAP on the right), *p < 0.05 after multiple comparison correction, +p < 0.05 before multiple comparison correction. Example of three segmentation slices produced for each ROI per segmentation method displayed for the same participant (healthy participant) (A–G). A = anterior, alERC = anterolateral entorhinal cortex; P = posterior; PHC = parahippocampal cortex; pmERC = posteromedial entorhinal cortex; PRC = perirhinal cortex; SUB = subiculum.
