. 2024 May 20;29(5):e112848. doi: 10.1136/bmjebm-2024-112848

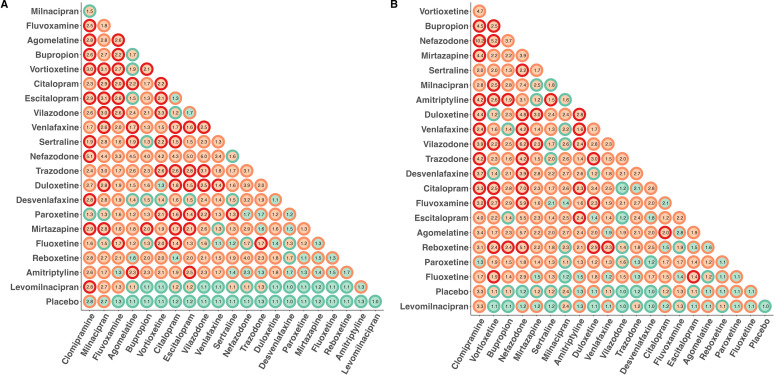
Figure 2. VoE in the 231 comparisons across the 22 treatments, classified according to their degree of VoE. (A) For treatment response. (B) For treatment discontinuation. For each dot, the centre indicates the existence of a Janus effect (green=no, orange=yes), the outline indicates the existence of statistically significant results in two opposite directions (green=comparisons that obtained consistent results with only significant differences (or only non-significant differences) at the 5% level, orange: comparison that yielded both significant and non-significant results at the 5%, red: significant results observed in opposite directions). Numbers correspond to the relative ORs which are ratios quantifying the ratios of ORs at the 1st and 99th percentile. The higher the relative OR, the greater the variability of results arising from the network geometries considered. VoE, vibration of effects.

Figure 2