. 2024 Jul 10;83(11):e224898. doi: 10.1136/ard-2023-224898

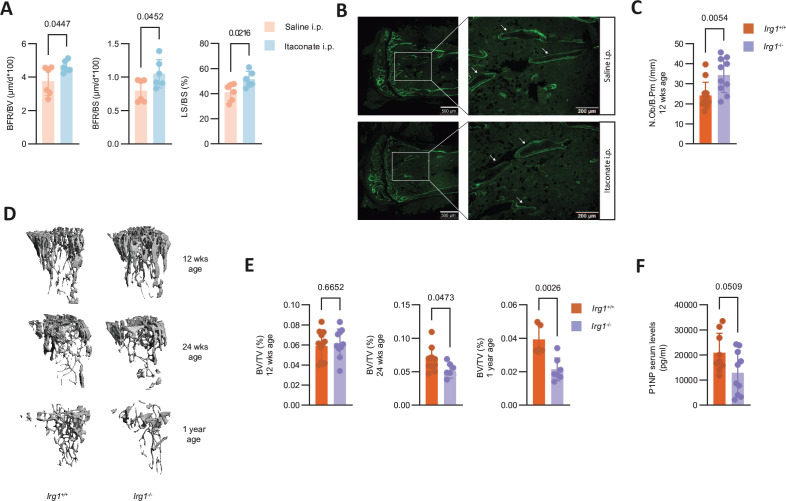
Figure 6. Itaconate stimulates osteoblast function in vivo. (A) Bone formation rate per bone volume (BFR/BV (µm/d×100)), bone formation rate per bone surface (BFR/BS (µm/d×100)) and labelled surface per bone surface (LS/BS) of tibial bones from mice daily receiving intraperitoneal injections with either saline or itaconate as assessed by calcein labelling (n=6). (B) Representative fluorescence images of calcein labelled bone from mice shown in (A). White arrows indicate surfaces with fluorescent mono layers or double layers. Scale bars represents 500 µm and 200 µm. (C) Number of osteoblasts per bone perimeter (No.OB/B.PM (/mm)) of tibial bones from 12-weeks-old Irg1+/+ and Irg1−/− mice (n=10–12). (D) Representative 3D reconstructions of tibiae from 12 weeks, 24 weeks and 1-year-old Irg1−/−- or Irg1+/+ mice. (E) Bone volume per tissue volume (BV/TV (%)) of tibiae from 12 weeks, 24 weeks and 1-year-old Irg1−/− or Irg1+/+ mice assessed by µCT analysis (n=5–12). (F) Serum levels of N-Terminal Propeptide Of Type I Procollagen (P1NP) from 24 weeks old Irg1+/+ and Irg1−/− mice as determined with ELISA (n=10). The data are represented as means±SDs. Unpaired t-test (A, C, E, F). Irg1, immunoresponsive gene 1.

Figure 6