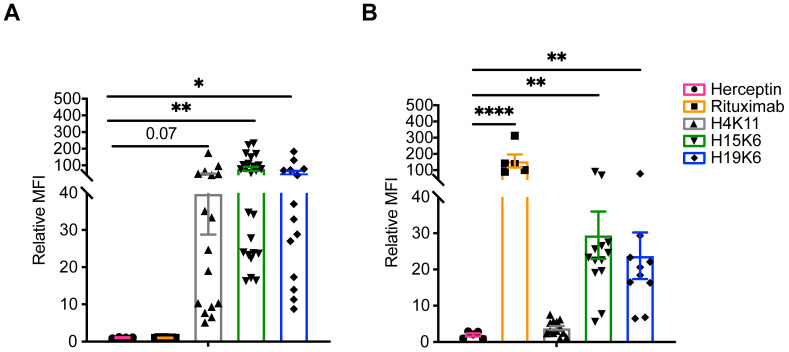
Figure 1.
Binding of human anti-MUC1 mAbs and control antibodies on target cells. Surface staining with indicated antibodies and goat anti-human IgG secondaries on Jurkat MUC1 22TR (A) or Raji MUC1 22TR (B). As cytometer voltages were set independently for each experiment, the geometric mean fluorescence intensity (MFI) of each primary-antibody containing a sample was normalized to a secondary-only negative control. Each dot represents an individual staining (n = 4–25, Jurkat MUC1 22TR utilizing either PGK or EF1α promoters to drive MUC1 gene expression; n = 5–13 Raji MUC1 22TR); bars depict mean ± SEM. Comparisons made by Kruskal-Wallis test with Dunn’s correction for multiple testing. * p < 0.05, ** p < 0.01, **** p < 0.0001.

