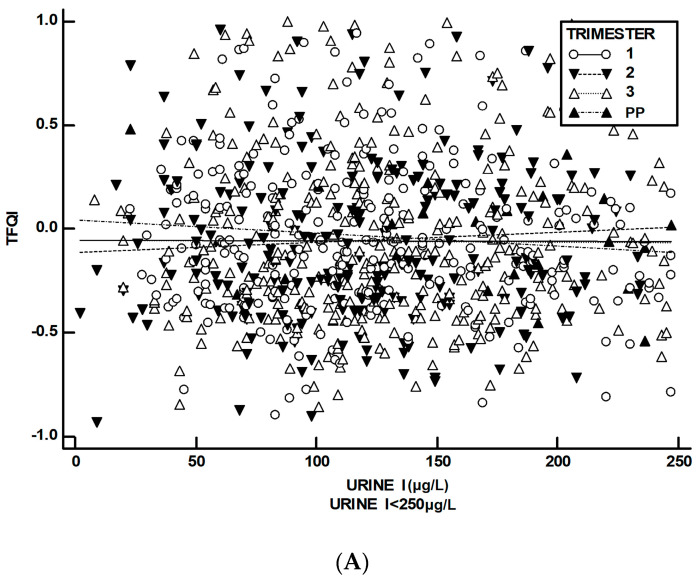
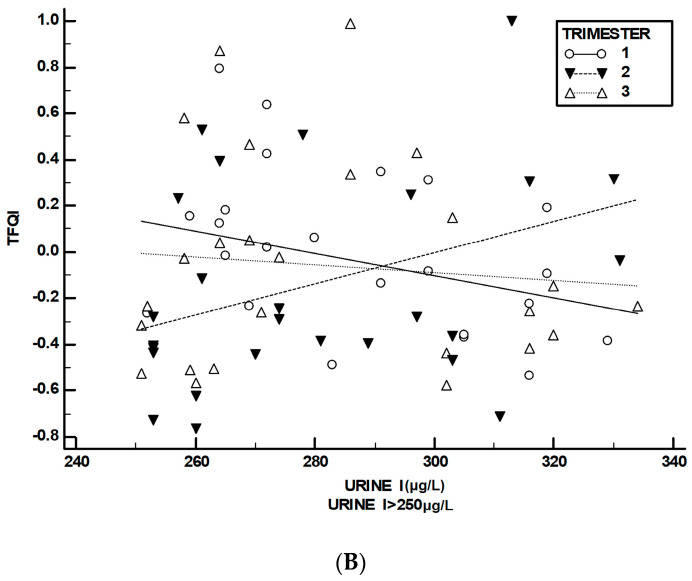
Figure 2.
Scatter plots with ordinary least squares (OLS) regression lines for the TFQI vs. urine iodine (UI) levels up to 250 μg/L (A) and above 250 μg/L (B) during each trimester and the postpartum period (PP). Note: In the postpartum period, only one UI measurement exceeded 250 μg/L, precluding OLS regression for this time period.


