
Figure 5.
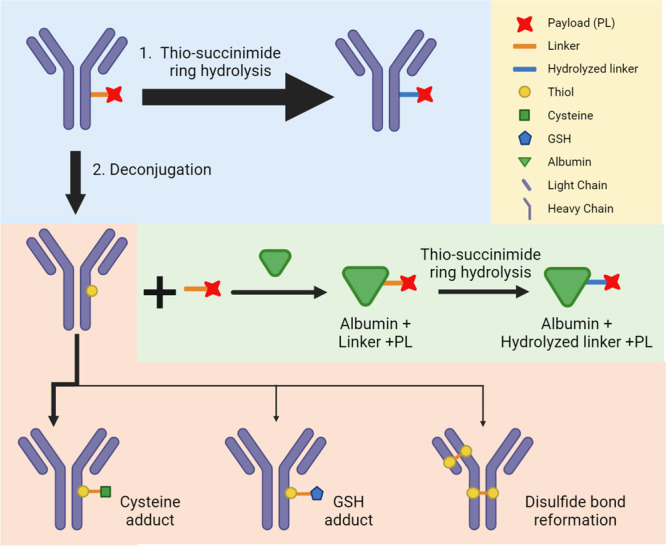
Biotransformation pathway diagram for the 4 ADC studied here. The blue box highlights the first step of biotransformation pathway, where the linker thio-succinimide ring is either hydrolyzed, stabilizing the conjugation, or deconjugated, exposing the free thiol. Following deconjugation, the various components of the ADC can then each go through additional biotransformation reactions. Arrow thickness indicates the preponderance of biotransformation pathways. While all ADCs had an average DAR of ∼8, only one linker-payload per ADC is depicted here for simplicity. Created with BioRender.com.