Figure 10.
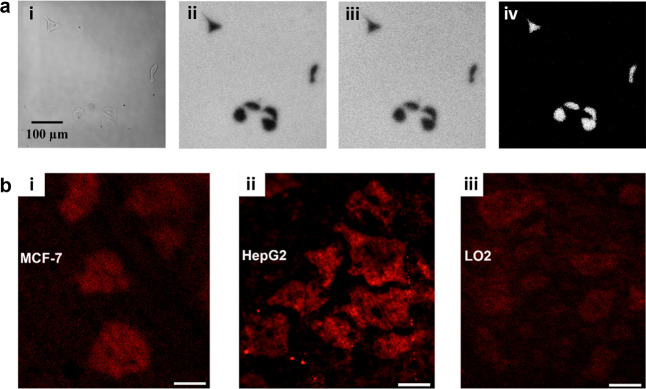
(a) Images of HeLa cells on ITO. (i) Bright-field (BF) image of HeLa cells. (ii) ECL image of the same HeLa cells in (i) with 200 μM L012. (iii) ECL image of the same HeLa cells in (i) with 200 μM L012 after stimulating cells by PMA. (iv) ECL image by subtracting (ii) from (iii). Scale bar: 100 μm. Reprinted from ref (117). Copyright 2015 American Chemical Society. (b) ECL images of MCF-7 (i), HepG2 (ii), and L02 (iii) cultured on the closed BPE system after stimulation by PMA (1μg/mL). The ECL system includes 1 mM Ru(bpy)32+ and 20 mM DBAE in 0.1 M PB (pH 7.0). Exposure time: 1 s, scale bars: 30 μm. Reprinted from ref (120). Copyright 2022 American Chemical Society.

