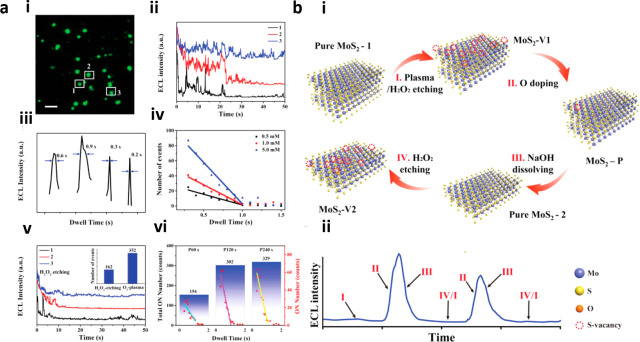
Figure 8.
(a) Analysis of ECL bursts controlled by sulfur vacancy and oxygen doping. (i) ECL image of MoS2 after oxygen plasma treatment (MoS2–P) in 10 mM PBS containing 200 μM L012 and 5 mM H2O2. Scale bar: 10 μm. (ii) Successive change of ECL intensity of three selected particles. (iii) Corresponding dwell time of random ECL bursts. (iv) Corresponding ON events with dwell time in different H2O2 concentrations. (v) ECL intensity change after H2O2 etching for 18 h. The inset shows the different ON events number between H2O2 etching and O2 plasma treatment for 10 particles. (vi) Total ON events (black) and separate ON events (red) for 10 particles with different O2 plasma treatment time: 60, 120, and 240 s. The correlation between ON events and dwell time could also be found. (b) Schematic illustration of ECL bursts, where (i) indicates the mechanic pathway and (ii) indicates the corresponding ECL intensity change. Reprinted with permission from ref (106). Copyright 2021 Wiley-VCH.

