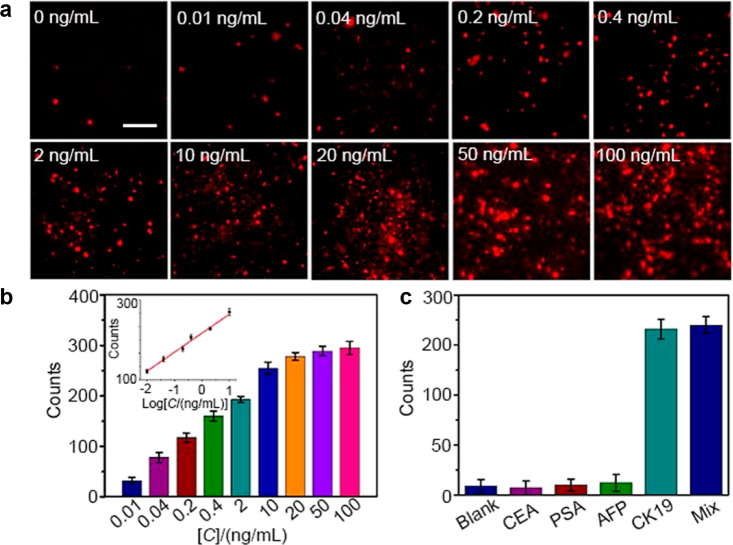
Figure 9.
(a) Single-molecule ECL images of different concentrations of CK 19. The luminophores are RuDSN/AuNPs. The electrodes used are ITO. Scale bar: 5 μm. (b) ECL counts of CK 19 from 0.01 to 100 ng/mL. The inset diagram indicates the linear relationship between ECL counts and the logarithm of CK 19 concentrations (0.01 to 10 ng/mL). (c) Specificity tests with target CK 19 (0.4 ng/mL) and other proteins (40 ng/mL). Reprinted from ref (112). Copyright 2021 American Chemical Society.

