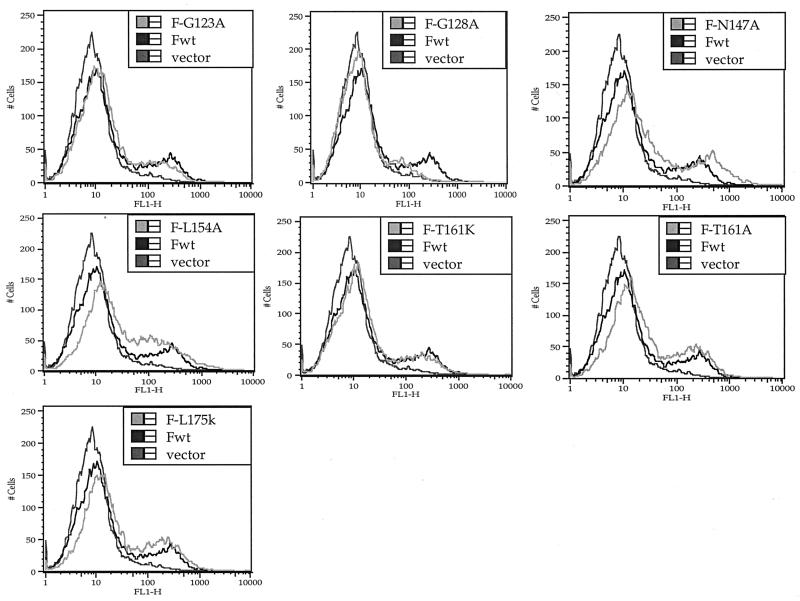
FIG. 5.
Flow cytometry analysis of mutant-expressing cells. Cells transfected with 0.5 μg of DNA/35-mm plate (suboptimal levels) were processed for analysis by flow cytometry as described in Materials and Methods. Only data for mutant proteins expressed at the surface are shown. The primary antibody was anti-NDV. Each panel shows background (cells transfected with vector alone) and wild-type data (Fwt) as well as data for one mutant.

