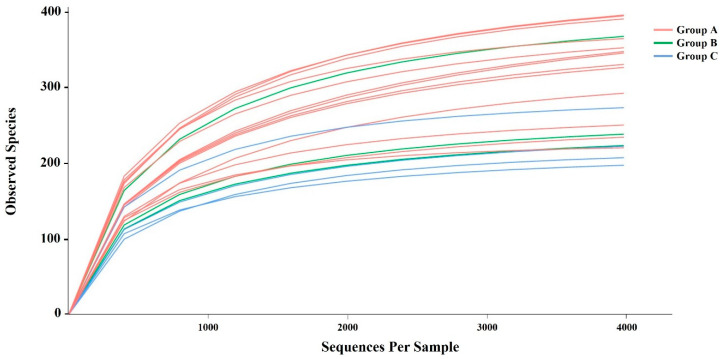
Figure 2.
Rarefaction curves of observed species for the 20 SMD samples, with each curve color-coded according to the sampling locations. The X-axis represents the number of valid sequences per sample and the Y-axis denotes the observed species (operational taxonomic units, OTUs). As the sequencing depth increases, the observed species also increases and stabilizes with the expansion of extracted sequences, signifying an optimal point where the quantity of sequencing data is sufficient.

