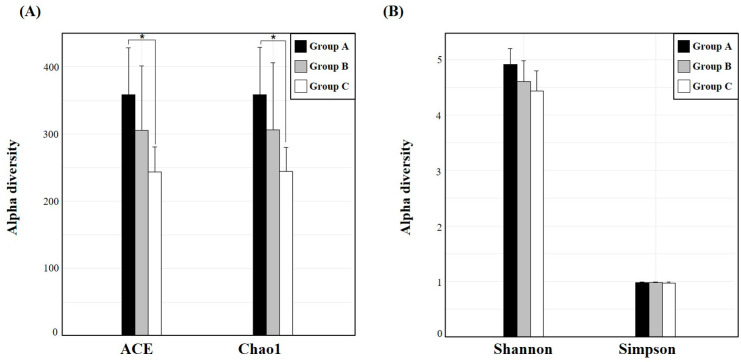
Figure 5.
Bar diagrams depicting α-diversity indices of the gut microbiota among Groups A, B, and C. (A) The ACE and Chao1 indices were used to assess the number of OTUs within each community. (B) The Shannon and Simpson indices were used to estimate microbial diversity within each group. * represents p < 0.05.

