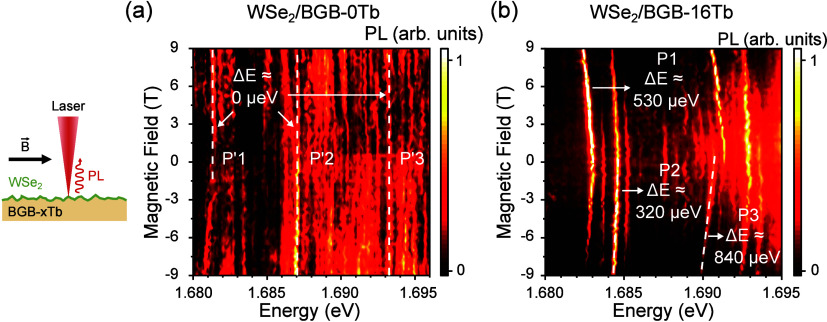
Figure 3.
On the left, a schematic drawing of μ-PL measurement under a magnetic field applied parallel to the plane of the monolayer. (a, b) Color-coded map of the PL intensity as a function of the magnetic field for the 0% and 16% Tb3+ samples, respectively. Each color-coded plot was normalized by the maximum intensity. The magnitude of the peak position displacement with increasing magnetic field depends on the sample and laser position.

