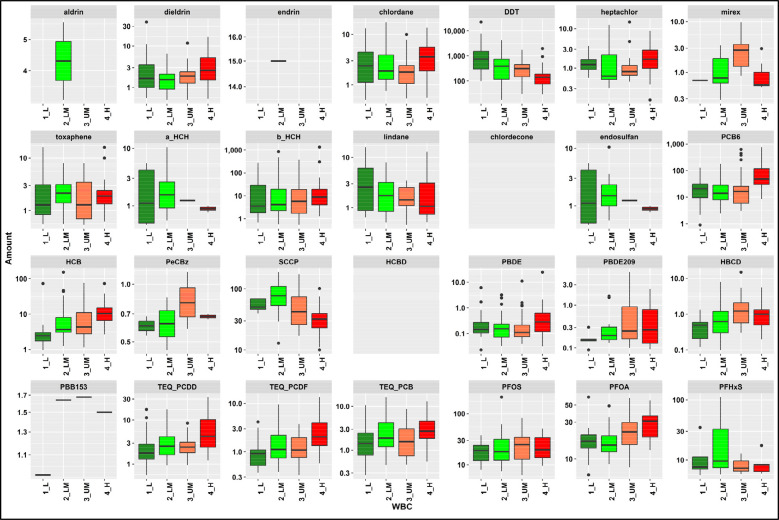
Figure 2.
Scaled box plots by POP and WBC, logarithmic scale for amounts. The whiskers represent the minimum and maximum amounts without outliers. The lower border of the box represents the first quartile (25%), the line inside the box is the median, and the upper border is the third quartile (75%). The dots outside the whiskers are outliers, which were defined as all concentrations greater or smaller than the interquartile range multiplied by 1.5.

