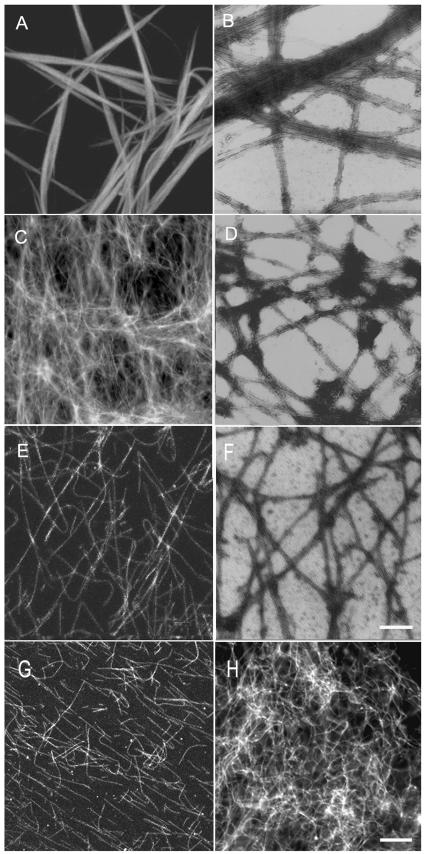
Figure 2.
Microtubule organization in the presence of AtMAP65-1 and AtMAP65-6. Fluorescent images are shown in A, C, and E, and electron micrographs are shown in B, D, and F. A and B, Microtubule bundles induced by AtMAP65-1. C and D, Microtubule mesh-like network induced by AtMAP65-6. E and F, Microtubules polymerized in the absence of MAP65. G, Microtubule bundles induced by AtMAP65-1 were sensitive to NaCl. Single microtubules were found upon 300 mm NaCl application. H, Microtubule mesh-like network induced by AtMAP65-6 was resistant to 500 mm NaCl treatment. Similar microtubule mesh was found as when there was no NaCl. Scale bar = 10 μm for fluorescent images and 0.25 μm for electron microscopic images.

