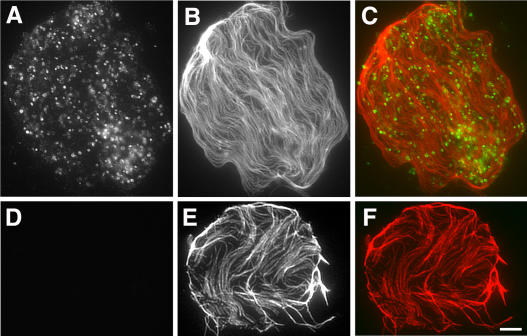
Figure 7.
Immunolocalization of AtMAP65-6. A to C, Dual localization of AtMAP65-6 and microtubules. AtMAP65-6 detected organelle-like structures (A) adjacent to cortical microtubules (B). Merged image (C) shows AtMAP65-6 in green and microtubules in red. D to F, Immunofluorescence with control IgG. No signal was detected with control rabbit IgG (D), while cortical microtubules were still visualized (E). Merged image is shown in F. Scale bar = 5 μm.

