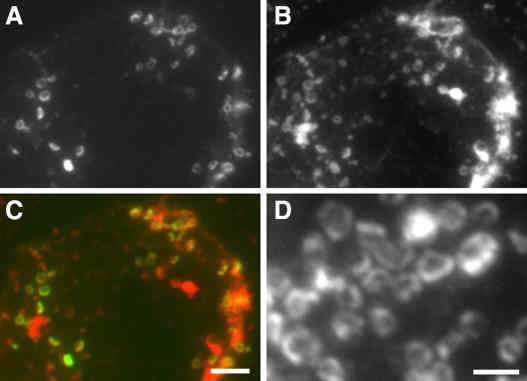
Figure 8.
Colocalization of AtMAP65-6 with mitochondria. A to C, Dual localization of AtMAP65-6 and mitochondria. Anti-AtMAP65-6 signal (A) and MitoTracker Red-detected signal (B) were overlapping in merged image (C), in which AtMAP65-6 is shown in green and mitochondria in red. D, AtMAP65-6 formed a ring at the periphery of mitochondria. Enlarged images show that AtMAP65-6 decorated the peripheral region of the mitochondria (D). Scale bars = 5 μm (A–C) and 2 μm (D).

