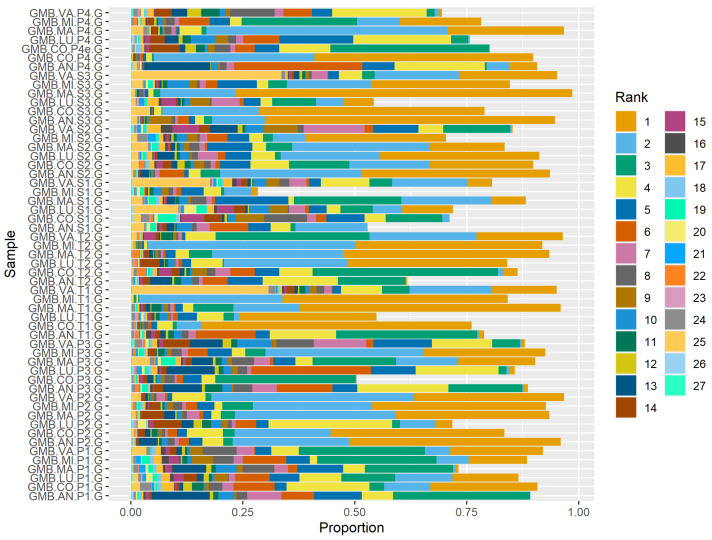
Figure 6.
Within-sample abundance (proportion) of core taxa. Sample identity on the y axis is ordered by sample period first (P = pasture, T = transition, and S = stable), then individual horse (AN, CO, LU, MA, MI, and VA). The colors reflect the ranks of the taxa; description of taxa included in Table 3.

