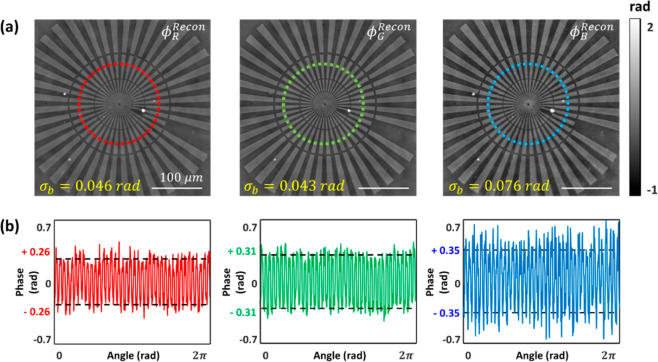
Figure 3.
sDPC phase images of a Siemens star phase target (Benchmark Technologies, USA). (a) Reconstructed quantitative phase images in each color. Each phase image is shown with the corresponding phase noise measured in the background (σb). (b) Line phase profiles along the red, green, and blue dashed circles in (a). The reconstructed phase values (red, green, and blue solid lines) agree greatly with the theoretical estimations (black dashed line).

