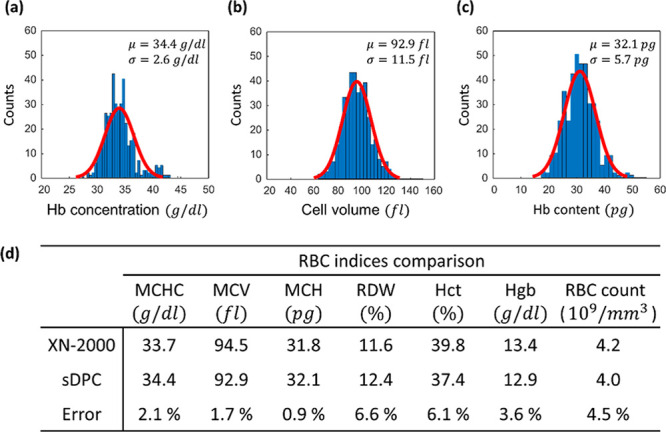
Figure 4.

sDPC-based measurements of the RBC indices. Single-cell-level distribution histograms of the Hb concentration (a), cell volume (b), and Hb content (c). All histograms are presented with Gaussian fits (red solid line) and the mean (μ) and standard deviation (σ) values. (d) Mean values of the extracted RBC indices are compared with those from the clinical hematology analyzer.
