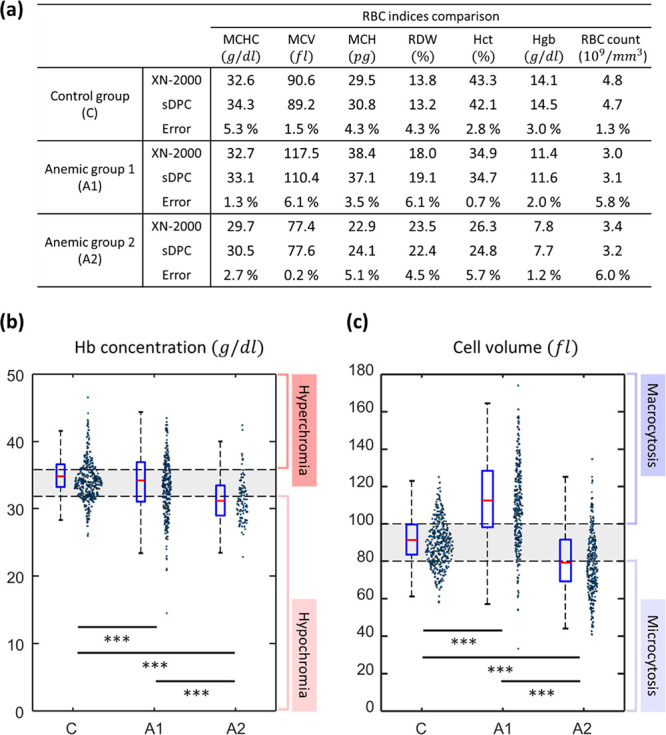
Figure 5.

sDPC-based measurements of RBC indices for the control and anemic groups. (a) Compared bulk mean values of RBC indices from the hematology analyzer and sDPC. Hb concentration (b) and cell volume (c) are presented as the boxplots and swarm charts, along with the p-values of the student’s t test. *** indicates that the p-value of the selected two groups is less than 0.001. The gray shaded regions in (b) and (c) denote the normal reference ranges of MCHC and MCV, indicating normochromia and normocytosis, respectively. Each box plot indicates the median value (red line) and interquartile range (blue box) of a given set, and the whiskers are extended to the extreme values.
