Figure 3.

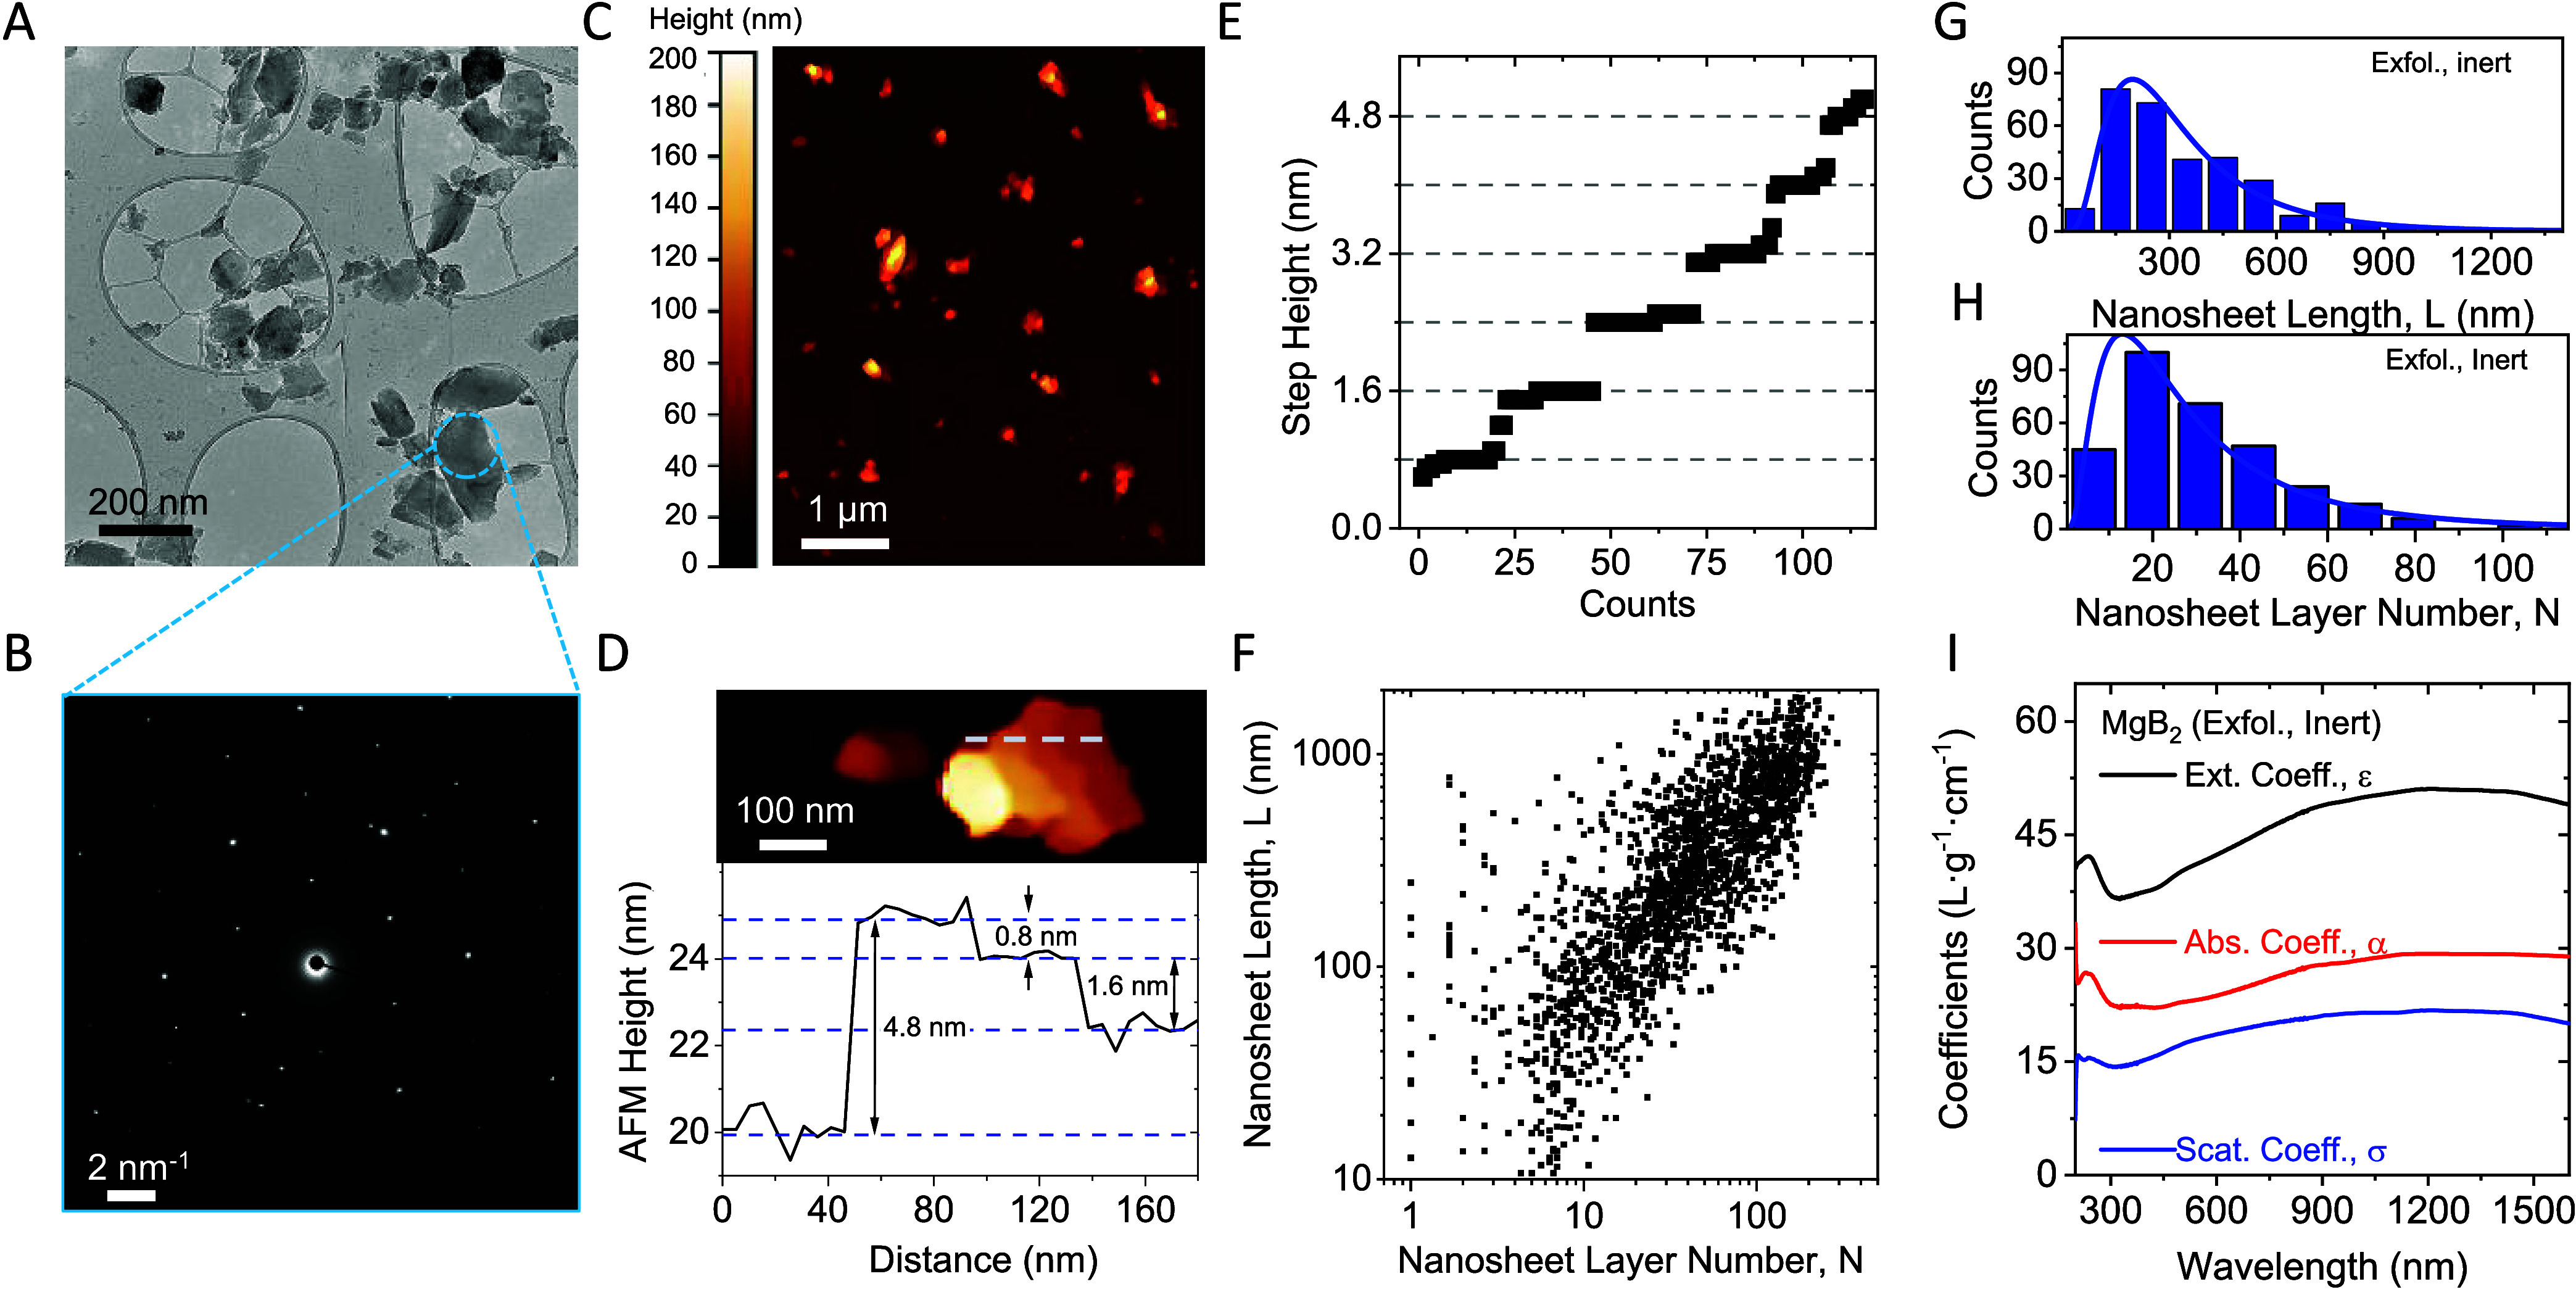
Quantitative characterization of MgB2 nanoplatelets prepared under inert conditions. (A) Bright-field TEM image of drop cast MgB2 nanoplatelets. A distribution of different sizes is observed, similar to the nanomaterials observed in the SEM. (B) SAED for the triangular particle in panel (A). The probed region is indicated by the dashed circle and demonstrates the reasonable crystallinity of the nanomaterial. (C) Overview AFM image of MgB2 nanosheets. Particles of a similar size and shape to those seen in TEM are observed. (D, E) Conversion of the apparent AFM height into the LPE MgB2 layer number using line profiles on nanoparticles with suitable steps and terraces. An example is shown in panel (D), while the statistical analysis of suitable steps is presented in panel (E). The data are sorted in ascending order, revealing discrete steps of ∼0.8 nm. (F) Scatter plot of the overall nanosheet size and thickness distribution measured using statistical AFM. The data includes the size and thickness of over 1500 nanoparticles with an average length/thickness aspect ratio of ∼12.9. (G, H) Histograms of the lateral nanosheet size (G) and the layer number (H) from statistical analysis of line profiles on individual nanosheets. (I) Optical extinction (black), absorbance (red), and scattering (blue) coefficient spectra for MgB2 nanoparticles exfoliated under inert conditions.
