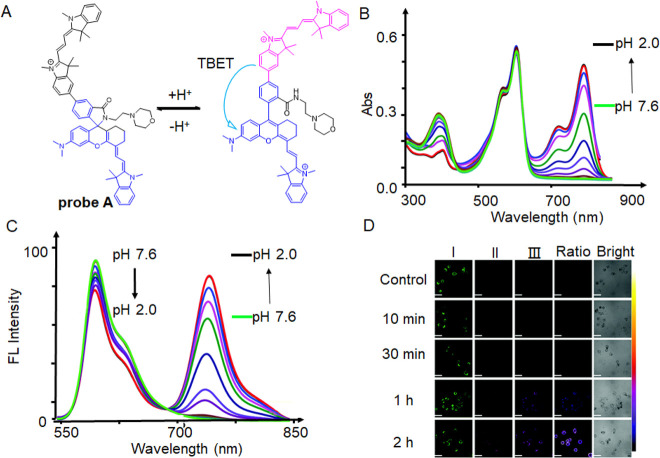
Figure 10.
(A) Ratiometric fluorescent probe A and its structural responses to pH changes. (B) Absorption spectra of probe A at different pH values. (C) Fluorescence spectra of probe A (10 μM, λex = 520 nm) with pH changing from 7.6 to 2.0. (D) HeLa cells were imaged using ratiometric fluorescence with probe A in a serum-free solution at different periods of donor and acceptor excitation with scale bars of 50 μm. By dividing the visible fluorescence in the first channel by the near-infrared fluorescence in the second channel, ratio images were created. Reproduced with permission from ref (88). Copyright 2020 Royal Society of Chemistry.

