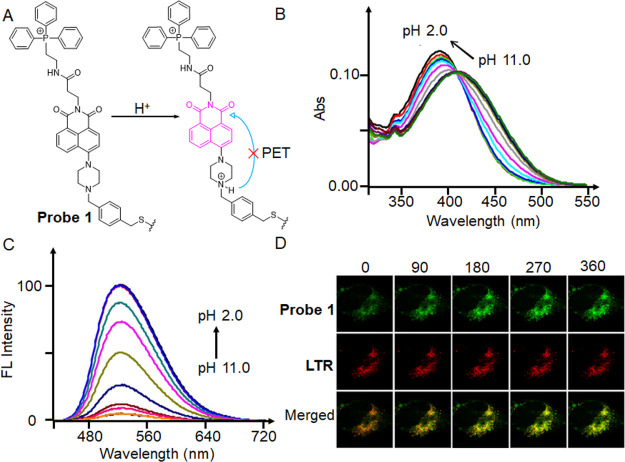
Figure 12.
(A) Ratiometric fluorescent probe 1 and its structural response to pH changes. (B) Absorption and (C) fluorescence spectra of compound 2, an analogue of probe 1 lacking the benzyl chloride functionality, recorded at different pH values. (D) Time course (0–360 s) images of nutrient-deprived cells. With a 488 nm excitation wavelength and 510–550 and 570–660 nm band-path emission filters, all pictures were captured. Reproduced from ref (91). Copyright 2014 American Chemical Society.

