Figure 5.
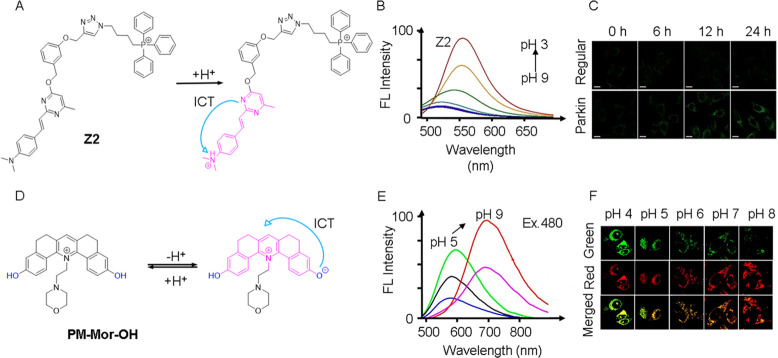
(A) Molecular structure and pH sensing mechanism of probe Z2. (B) Fluorescence spectra of Z2 (λex = 450 nm). (C) HeLa cells and Parkin-HeLa cells pretreated with 10 μM CCCP, and then stained with Z2. λex/em = 458/480–520 nm. Scale bar = 20 μm. (A–C) Reproduced with permission from ref (54). Copyright 2022 Wiley. (D) Molecular structure and pH sensing mechanism of probe PM-Mor-OH. (E) Ratiometric emission spectra of PM-Mor-OH (λex = 458 nm) in different pH solutions. (F) Imaging of HeLa cells under different pH conditions treated with PM-Mor-OH. Scale bar = 10 μm. (D–F) Reproduced from ref (56). Copyright 2022 American Chemical Society.

