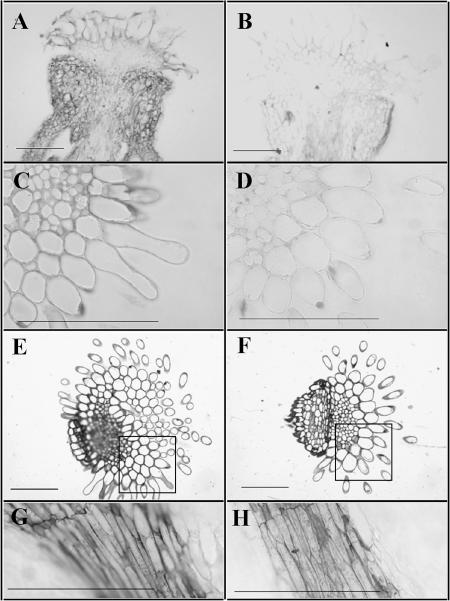
Figure 6.
Plantacyanin protein levels are increased in Arabidopsis plantacyanin overexpression pistils. Overexpression pistils are on left, wild-type on right. Immunohistochemical analysis on FAA-fixed, paraffin-embedded tissues (cut at 8 μm) shows that plantacyanin levels are elevated throughout the overexpression pistil (A) compared to that of the wild type (B). Glutaraldehyde-fixed, LR White-embedded tissues (cut at 3 μm) show that, in the stigma (C and D) and the style (G and H), there is a modest increase in plantacyanin levels in the transmitting tract of the overexpressor compared to that of the wild type. E and F, Toluidine blue-stained sections of the stigma/style. The squared areas are comparable to those seen in C and D. Bars = 100 μm.

