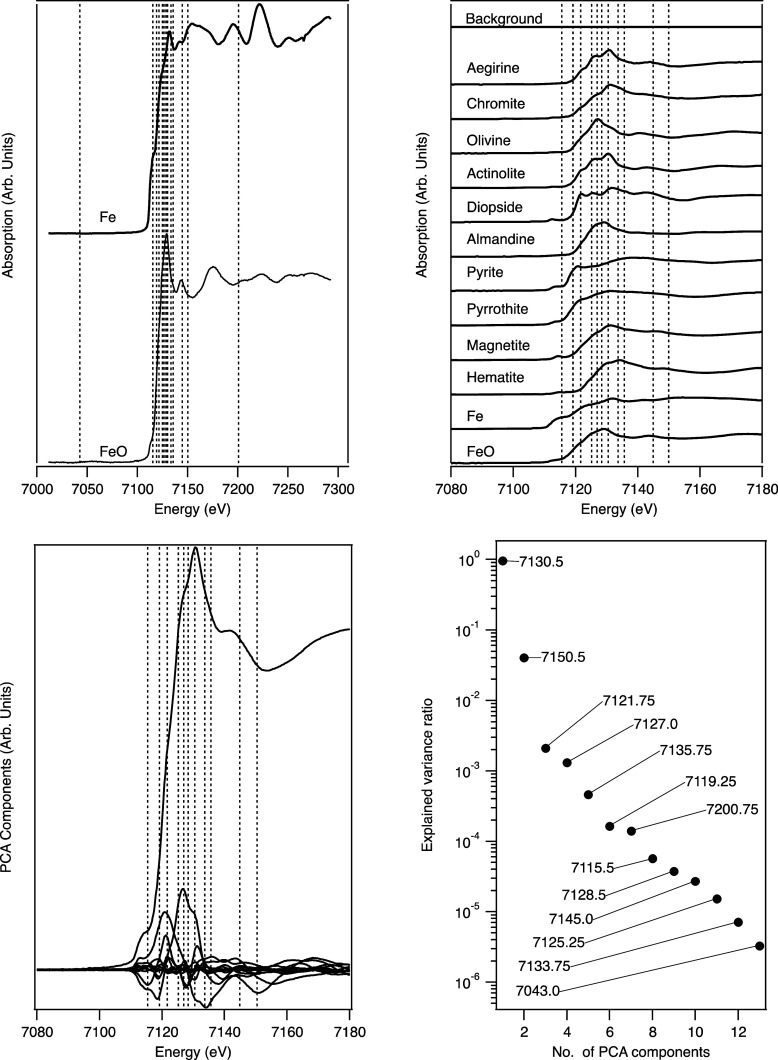
Figure 2.
Left to right, top to bottom: (a) Full XANES standard spectra from two example standards (solid lines) with all DEIM points (vertical dashed lines). (b) For visualization purposes, a selected subregion about the Fe absorption edges for the set of Fe spectra and the DEIM points within this region and (c) the corresponding PCA components, along with the (d) explained variance ratio of these PCA components and the order of DEIM point selection.

