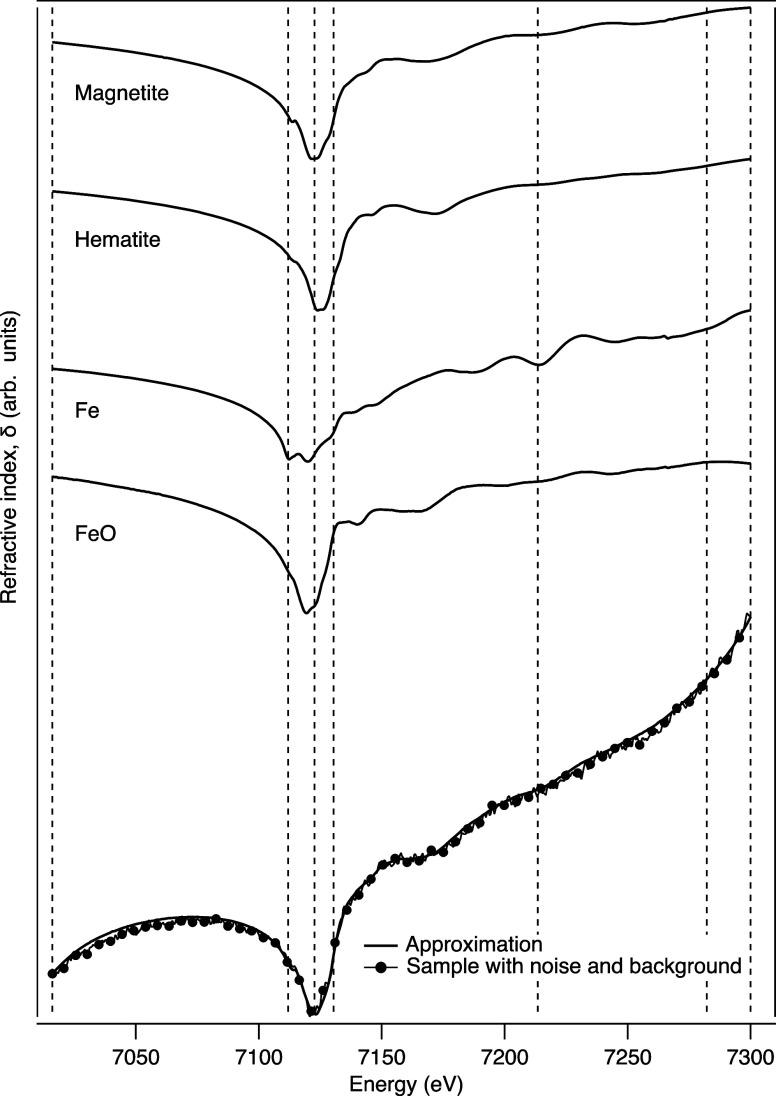
Figure 6.
Example of the application of the DEIM approach to refractive index measurements over an absorption edge. The figure shows the Kramers–Kronig transform of four absorption spectra and an example of the DEIM sampling points. Background variations and noise were also included, and a comparison of a noisy, varying spectrum with an approximation determined from seven DEIM points samples shows very good agreement.

