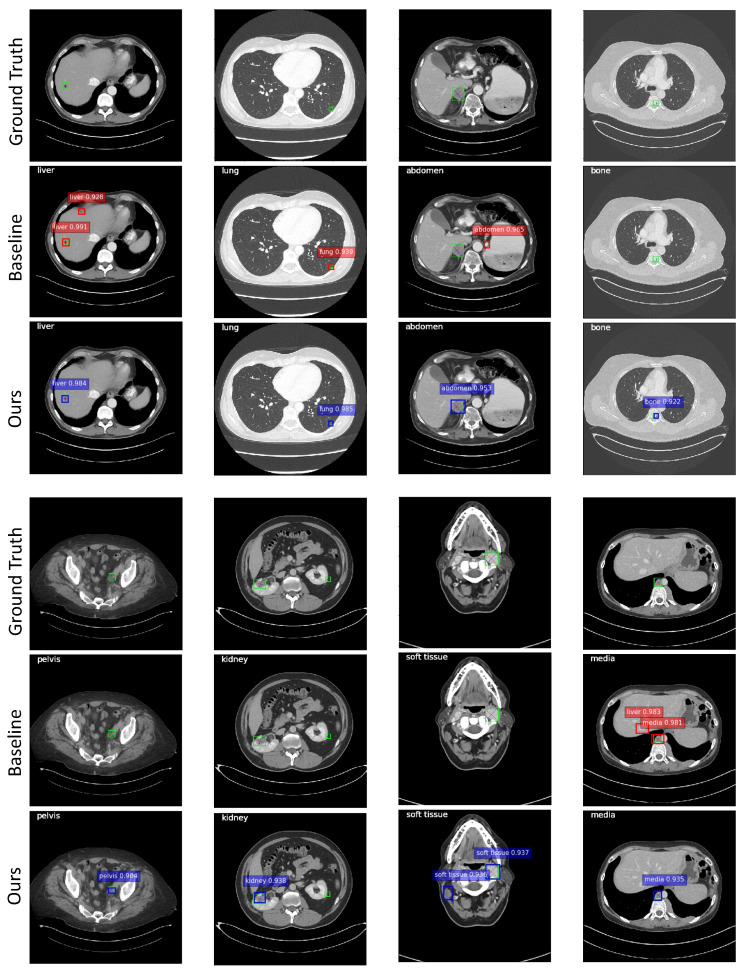
Figure 9.
Qualitative results using the DA-SHT Dense 3DCE framework on different lesions. The images in the second and fifth rows show the results of the 3DCE [1] network, and the images in the third and sixth rows show the results of our model. Predictions with scores >0.9 are shown. The categorical information in the upper left corner of each image is the ground truth of the lesion. The green bounding boxes with diameters in the first and fourth rows are ground truth bounding boxes. The bounding boxes in red and blue highlight the categorical and confidence scores of the automatic detection results, respectively.

