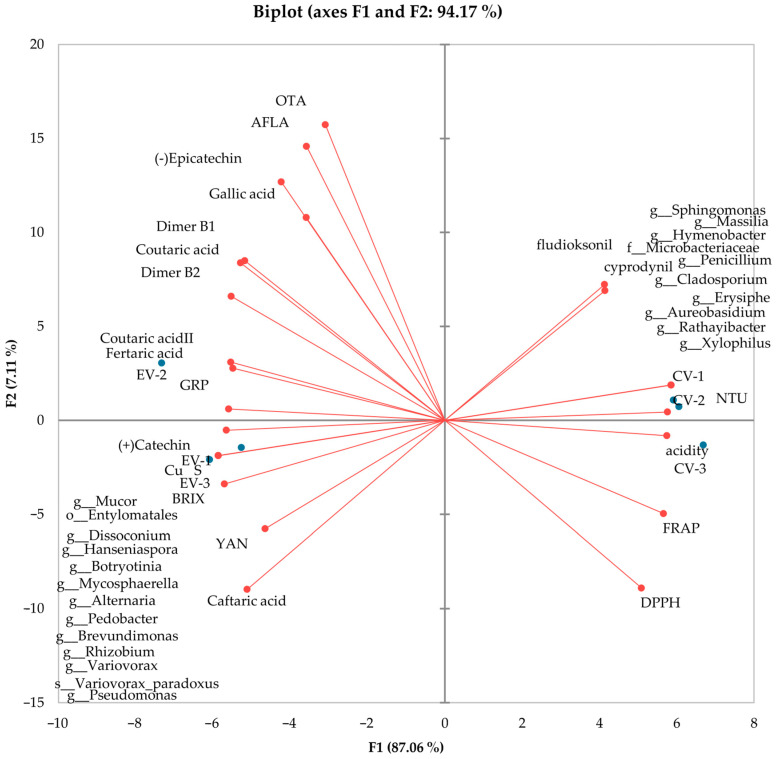
Figure 7.
PCA biplot shows the relation between the most abundant orders of bacteria, fungi, and tested parameters and their influence on ecological (EV 1, 2, 3) and conventional samples (CV 1, 2, 3). Blue points show variables (treatments), red lines with dots show vectors of observations (principal components).

