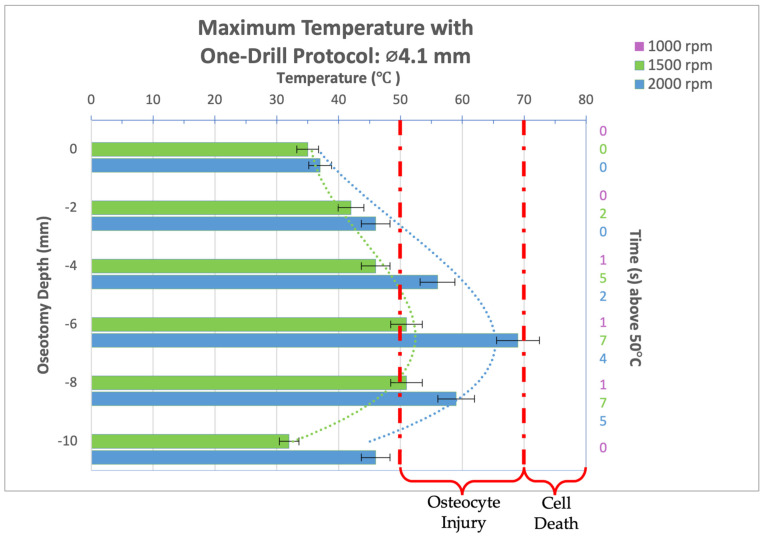
Figure 7.
Bar graph showing maximum temperatures reached when drilling into bone to a depth of 10 mm with the 4.1 mm diameter drill bit at a load of 2.3 kg and three different spindle speeds (1000, 1500, and 2000 rpm). Temperature range of bone cell injury and bone cell death are marked on graph. Left axis shows drilling depth (mm) while top axis shows maximum temperature reached (°C) at that depth. Right axis shows duration (seconds) temperatures exceeded 50 °C.

