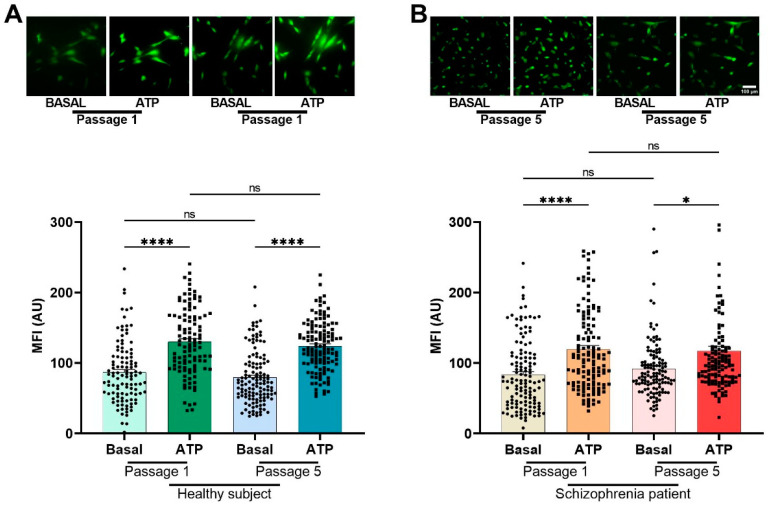
Figure 5.
Intracellular calcium response after stimulation with ATP in olfactory epithelial precursor cell populations of HS (A) and SZ (B) patients in passage 1 and passage 5. The cells were incubated for 30 min with 4 μM Fluo 4-AM diluted in the culture medium at 37 °C and 5% CO2. Images were captured before stimulation (basal) and 2 min after stimulation with 300 μM ATP. Each data point represents the mean fluorescence intensity (MFI) measurement of each cell. The MFI of at least 100 cells was determined. The graphs represent data obtained from at least six images (18–20 cells per image) per group. Data were expressed as mean ± SEM and compared using the Kruskal–Wallis and Dunn’s multiple comparisons tests. **** p < 0.0001, * p < 0.05; not significant (ns). AU: arbitrary units.

