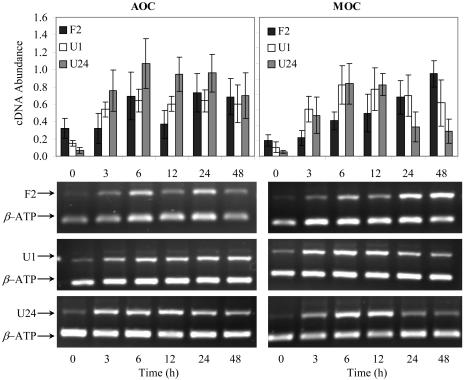
Figure 5.
Expression of AtGSTF2 (F2), AtGSTU1 (U1), and AtGSTU24 (U24) in 2-week-old Arabidopsis seedlings exposed to 0.625 mm AOC and 2 mm MOC. Total RNA was extracted from Arabidopsis at the times indicated on the graph (in hours). Five grams of total RNA was converted to cDNA with random primers. An internal standard β-ATP was used as control and samples were subjected to semiquantitative RT-PCR. Zero-hour exposure represents control (nonexposed plants). Bars represent the means and sd of triplicate determinations.

