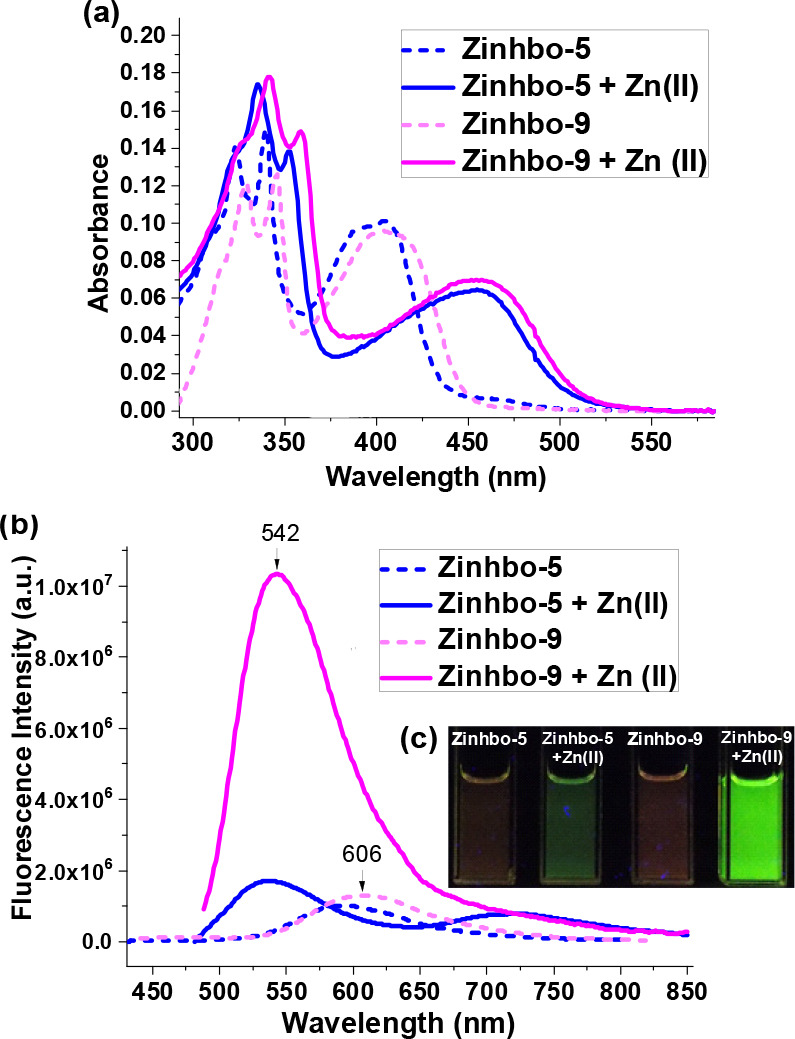
Figure 1.

UV–vis (a) and fluorescence spectra (b) of 10 μM Zinhbo-5 and Zinhbo-9 (broken line) in aqueous solution containing 50% EtOH and their zinc complex (solid line). (c) Fluorescent images taken when the same samples (for spectra) were irradiated with a 365 nm UV lamp at room temperature.
