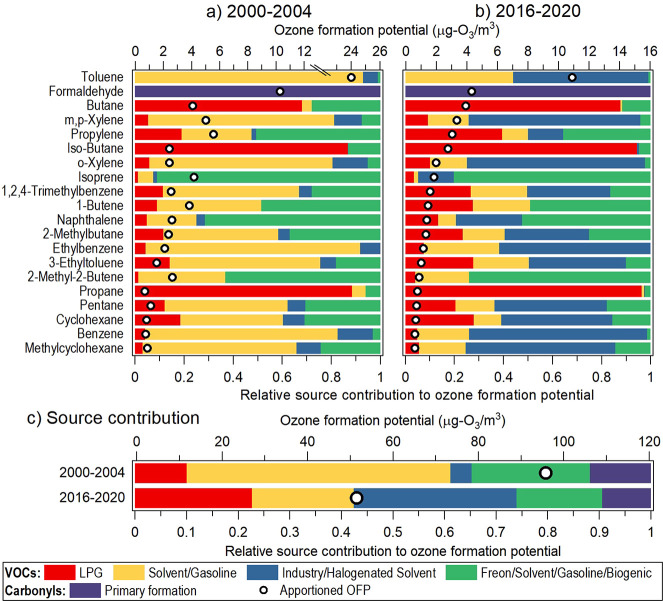
Figure 2.
Source contributions to the ozone formation potential (OFP) averaged from CW and TW sites. (a, b) Apportioned OFP (circle markers) and relative source contributions of the 20 most important compounds during (a) 2000–2004 and (b) 2016–2020. The compounds are arranged in descending order of OFP contribution in 2016–2020. (c) OFP contributions by source, including contributions from compounds beyond the top 20 list.

