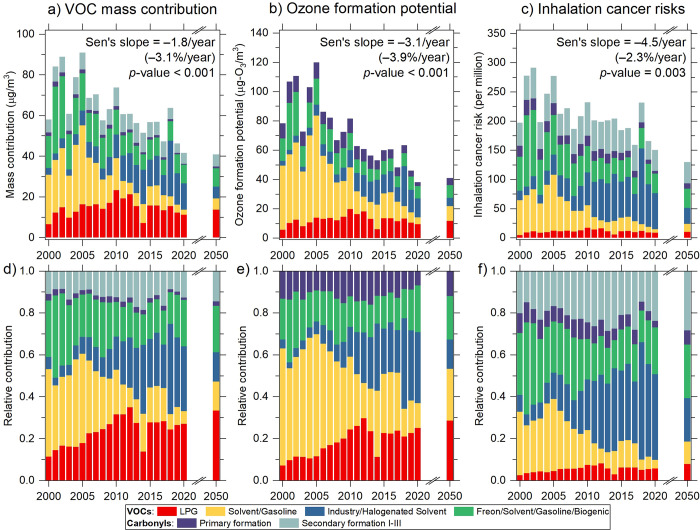
Figure 3.
Interannual trends in source contributions to VOCs and carbonyls by mass concentration, ozone formation potential, and inhalation cancer risks per million, averaged from CW and TW sites from 2000 to 2020. Prediction for 2050, assuming zero vehicular emissions and a best-health-effect pollution control scenario, is presented. The upper panels (a–c) and lower panels (d–f), respectively, show the absolute and relative contributions. The Sen’s slope values of the total source contributions and corresponding significance level of the Mann–Kendall trend test displayed in panels (a–c) are for 2000–2020. The percentage change in parentheses represents the Sen’s slope values normalized by the 2000 level.

