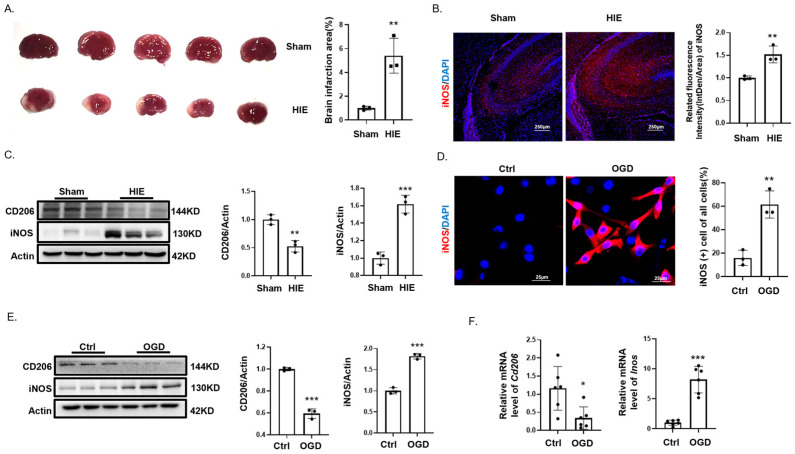
Figure 1.
Hypoxia-Induced M1 microglial polarization. (A) TTC staining highlights an extensive infarct area in the left hemisphere of the brain in the hypoxic–ischemic encephalopathy (HIE) model (n = 3). (B) Immunofluorescence of iNOS (+) microglial highlights increased in the infarct zone compared to sham. Scale bar = 250 μm (n = 3). (C) Western blotting of CD206 and iNOS shows differential expression in HIE versus sham brain tissues (n = 3). (D) Immunofluorescence shows a significant increase in M1 polarization of BV2 cells after 24 h of oxygen glucose deprivation (OGD) (n = 100). Scale bar = 25 μm. (E) Western blotting shows changes in CD206 and iNOS levels in BV2 cells after 24 h OGD (n = 3). (F) qPCR quantifies changes in Cd206 and Inos mRNA levels in BV2 post-OGD (n = 6). Significance; * p < 0.05; ** p < 0.01; *** p < 0.001.

