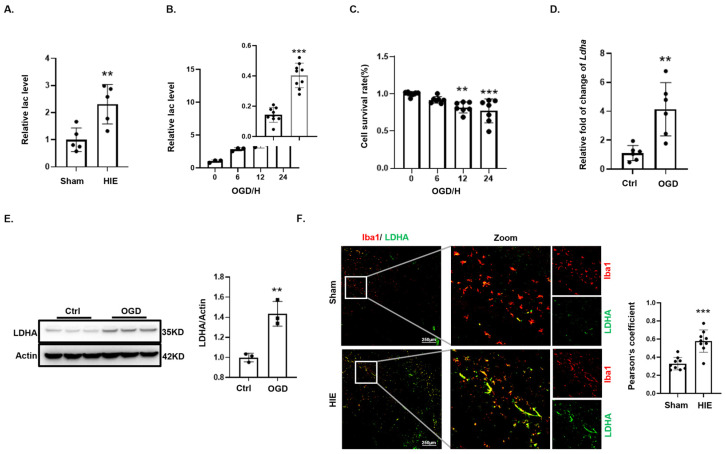
Figure 2.
Effects of glucose deprivation on microglial anaerobic metabolism. (A) Lactate assay comparison between brain tissues from subjected to HIE and sham controls (n = 3). (B) Lactate quantification in BV2 cell over time during OGD, normalized relative to cell counts (n = 3). (C) Cell viability changes during OGD assessed by CCK8 assays (n = 6). (D) Ldha mRNA levels in BV2 cells post-OGD measured via qPCR (n = 6). (E) LDHA protein levels in BV2 cells post-OGD analyzed by Western blotting (n = 3). (F) LDHA expression in microglia (Iba1-positive) from sham and HIE groups shown by immunofluorescence, with Iba1 in red and LDHA in green. Scale bar = 100 μm (n = 9). Significance: ** p < 0.01; *** p < 0.001.

