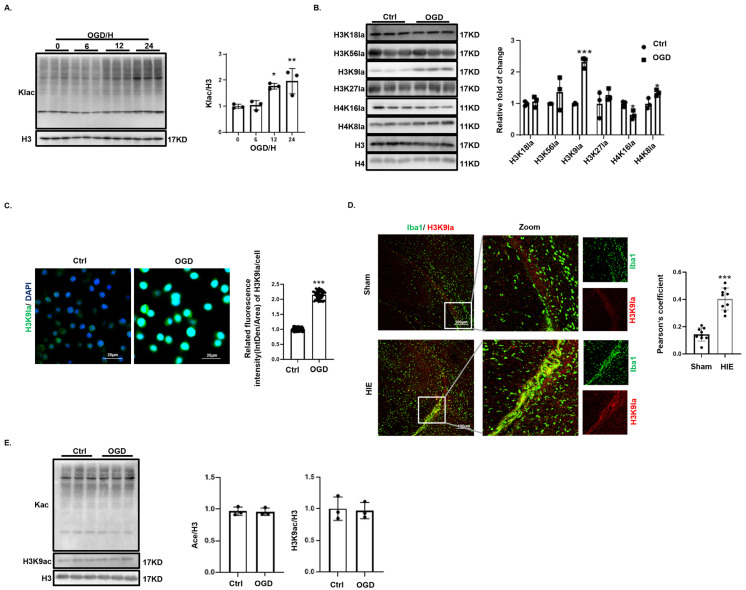
Figure 3.
Increased H3K9 lactylation following glucose deprivation. (A) Total protein lactylation levels in BV2 cells during OGD, analyzed by Western blotting (n = 3). (B) Lactylation at H3K18, H3K56, H3K9, H3K27, H4K16, and H4K8 sites following OGD, shown by Western blotting (n = 3). (C) Significant increase in nuclear H3K9 lactylation in BV2 cells post-OGD, shown by immunofluorescence staining. Scale bar = 25 μm (n = 50). (D) H3K9 lactylation in Iba1-labeled microglia from sham-operated and HIE brain tissues, shown by immunofluorescence. Scale bar = 100 μm (n = 9). (E) Total protein acetylation and H3K9 acetylation levels in BV2 cells post-OGD, analyzed by Western blotting (n = 3). Significance: * p < 0.05; ** p < 0.01; *** p < 0.001.

