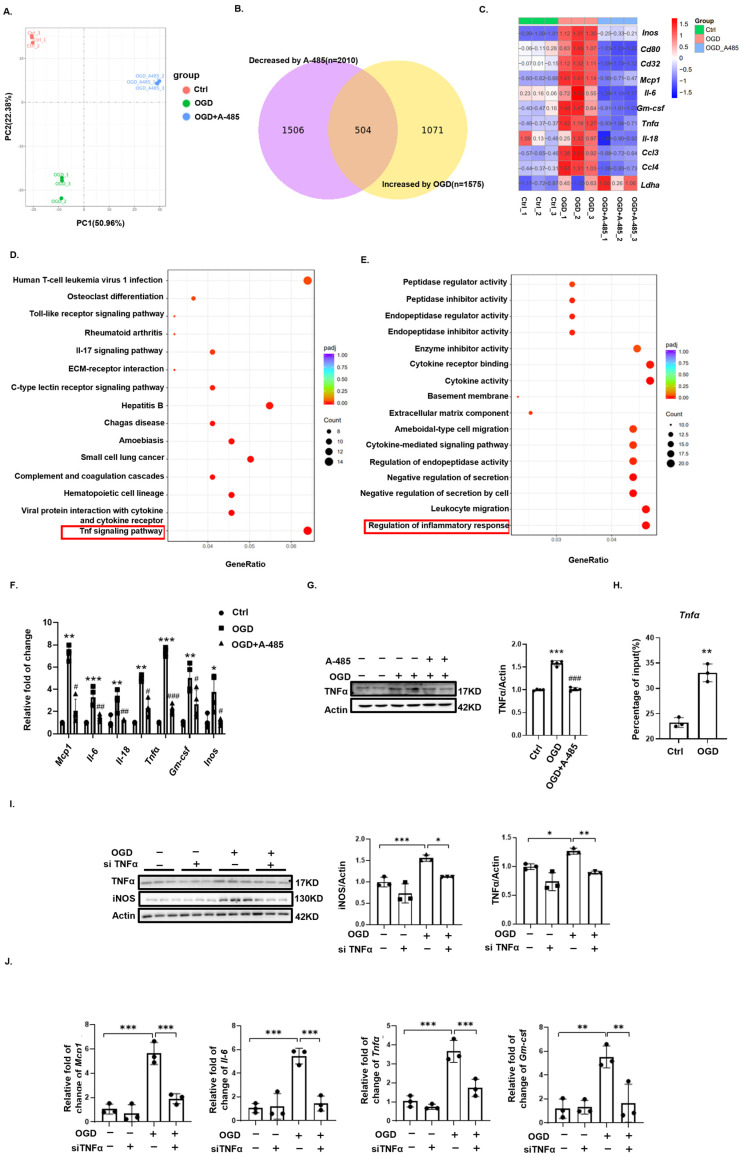
Figure 5.
Histone lactylation regulates microglial polarization through the TNFα pathway. (A) PCA plot of genes from the control, OGD, and OGD + A-485 groups. (B) Venn diagram of genes upregulated in the OGD group compared to the control group and downregulated in the OGD + A-485 group compared to the OGD group. (C) M1 microglia-specific genes among the control, OGD, and OGD + A-485 groups. (D) KEGG enrichment analysis of intersecting genes from the Venn diagram. (E) GO enrichment analysis of intersecting genes from the Venn diagram. (F) Western blotting analysis of TNFα levels in the control, OGD, and OGD + A-485 groups (n = 4). (G) Changes in inflammatory factors among the control, OGD, and OGD + A-485 groups (n = 4). *, **, ***, OGD vs. Ctrl; #, ##, ###, OGD + A-485 vs. OGD. (H) ChIP-qPCR analysis of H3K9 lactylation enrichment in the Tnfα DNA fragment (n = 3). (I) Changes in M1 microglial polarization among the control, siTNFα, OGD, and OGD + siTNFα groups (n = 3). (J) Changes in inflammatory factors among the control, siTNFα, OGD, and OGD + siTNFα groups (n = 3). Significance: * p < 0.05, ** p < 0.01, *** p < 0.001; # p < 0.05, ## p < 0.01, ### p < 0.001.

