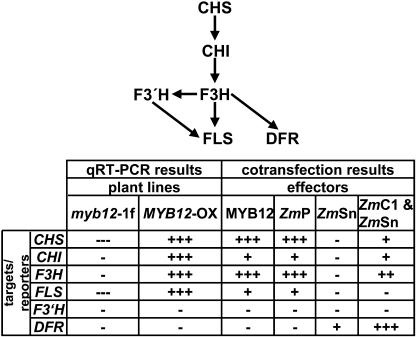
Figure 8.
Overview of MYB12 effects on flavonoid gene expression. The top of the figure shows a schematic representation of the enzymatic steps of flavonoid biosynthesis. The table below summarizes the results of the quantitative real time RT-PCR of mutant plants and the cotransfection analyses performed. “+” indicates weak, “++” medium, and “+++” strong gene expression or activation of reporter gene transcription, respectively; “−” indicates no effect on target gene expression or on activation of reporter gene transcription, “---” indicates strong reduction in target gene expression.

