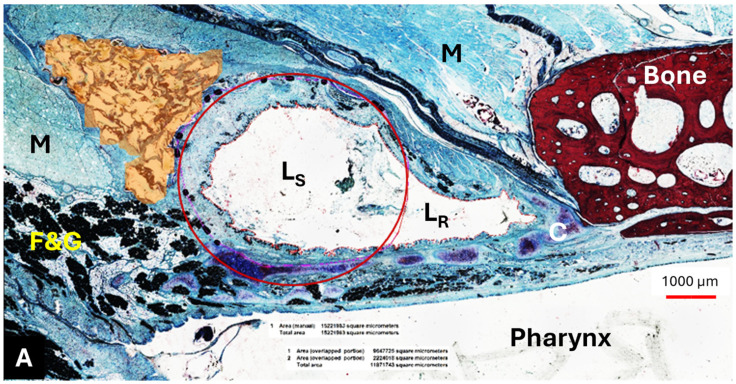
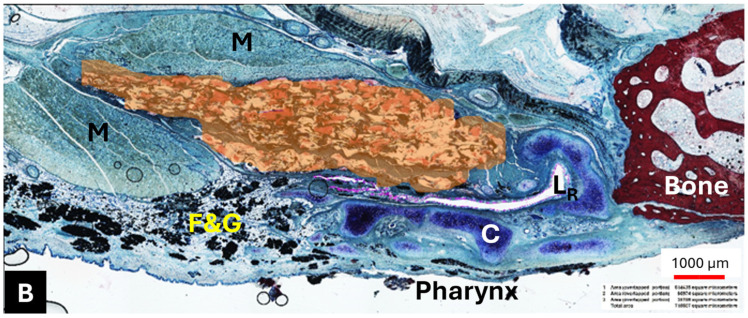
Figure 6.
The location of the HA depot (colored in orange) in animal A4 on the stent ((A) mirrored view) and control side (B) for section S2. M—muscle; F&G—fat and glandular tissue; C—ET cartilage; LS—stent lumen; LR—residual ET lumen; red circle—approximating the stent struts. The black dots in the vicinity of the circle are the stent struts.


