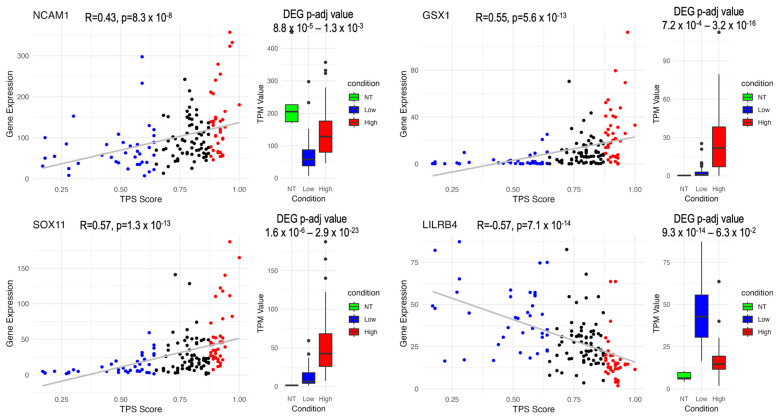
Figure 9.
Differential expression and correlation profiles of marker genes in GBM according to TPS: This figure presents the DEG and correlation profiles of GSX1, SOX11, LILRB4, and NCAM1 based on TPS (Tumor Proportion Score). GSX1, SOX11, and NCAM1 are positively correlated with TPS, while LILRB4 is negatively correlated. DEG p-adj value represents the comparison of Low TPS to NT and High TPS to NT, respectively. Categories include NT (Normal Tissue), Low (Low TPS group), and High (High TPS group). Blue (Low TPS), black (Mid TPS), and red (High TPS). The grey line represents the linear regression fit (R).

