Figure 1.
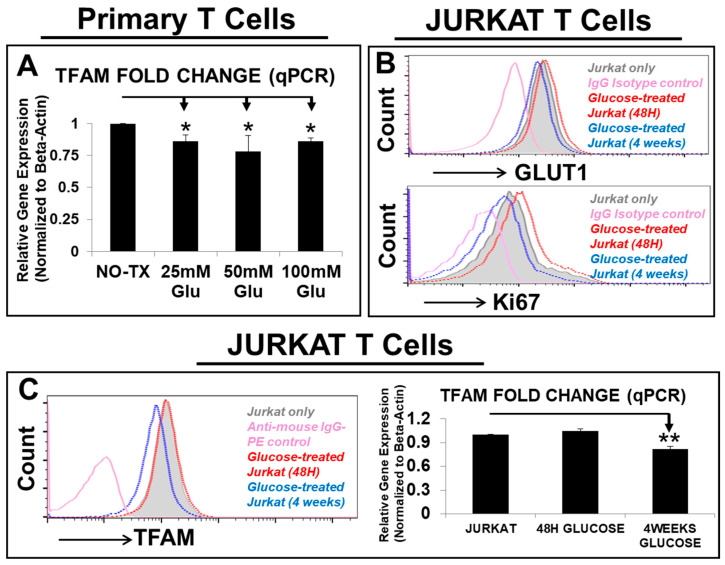
High glucose significantly reduced the expression of GLUT1 and TFAM in T cells. (A) Gene expression of TFAM, a mitochondrial transcription factor was analyzed by qPCR. Data of mRNA expressions show the fold change (normalized to β-actin) of the gene encoding TFAM in T cells from AML patient samples, which were pretreated with different doses of glucose; (B) representative FC histograms show the expression of GLUT1 and Ki67 in Jurkat cells which were pretreated with 25 mM glucose for 48 h (red line plot) or persistent supplementation of 25 mM glucose for 4 weeks in vitro (blue line plot); the filled grey line and pink line plots represent Jurkat without treatment and IgG-fluorescent control; (C) representative FC histograms show the expression of TFAM in Jurkat cells which were pretreated with 25 mM glucose for 48 h (red line plot) or persistent supplementation of 25 mM glucose for 4 weeks in vitro (blue line plot); the filled grey line and pink line plots represent Jurkat without treatment and IgG-fluorescent control; Right panel: qPCR data of mRNA expressions show the fold change (normalized to β-actin) of the gene encoding TFAM in Jurkat which were pretreated with or without different time points of 25 mM glucose; where applicable, data are means ± SEM. * p < 0.05, ** p < 0.01, n = 3.

